4 Ways To Schedule Revenue Over Time In Salesforce
How to avoid common pitfalls with your revenue forecast and take control of what's ahead.
Last updated June 3, 2026


Download the 12 Must-Have Charts for Your Salesforce Dashboard eBook today!
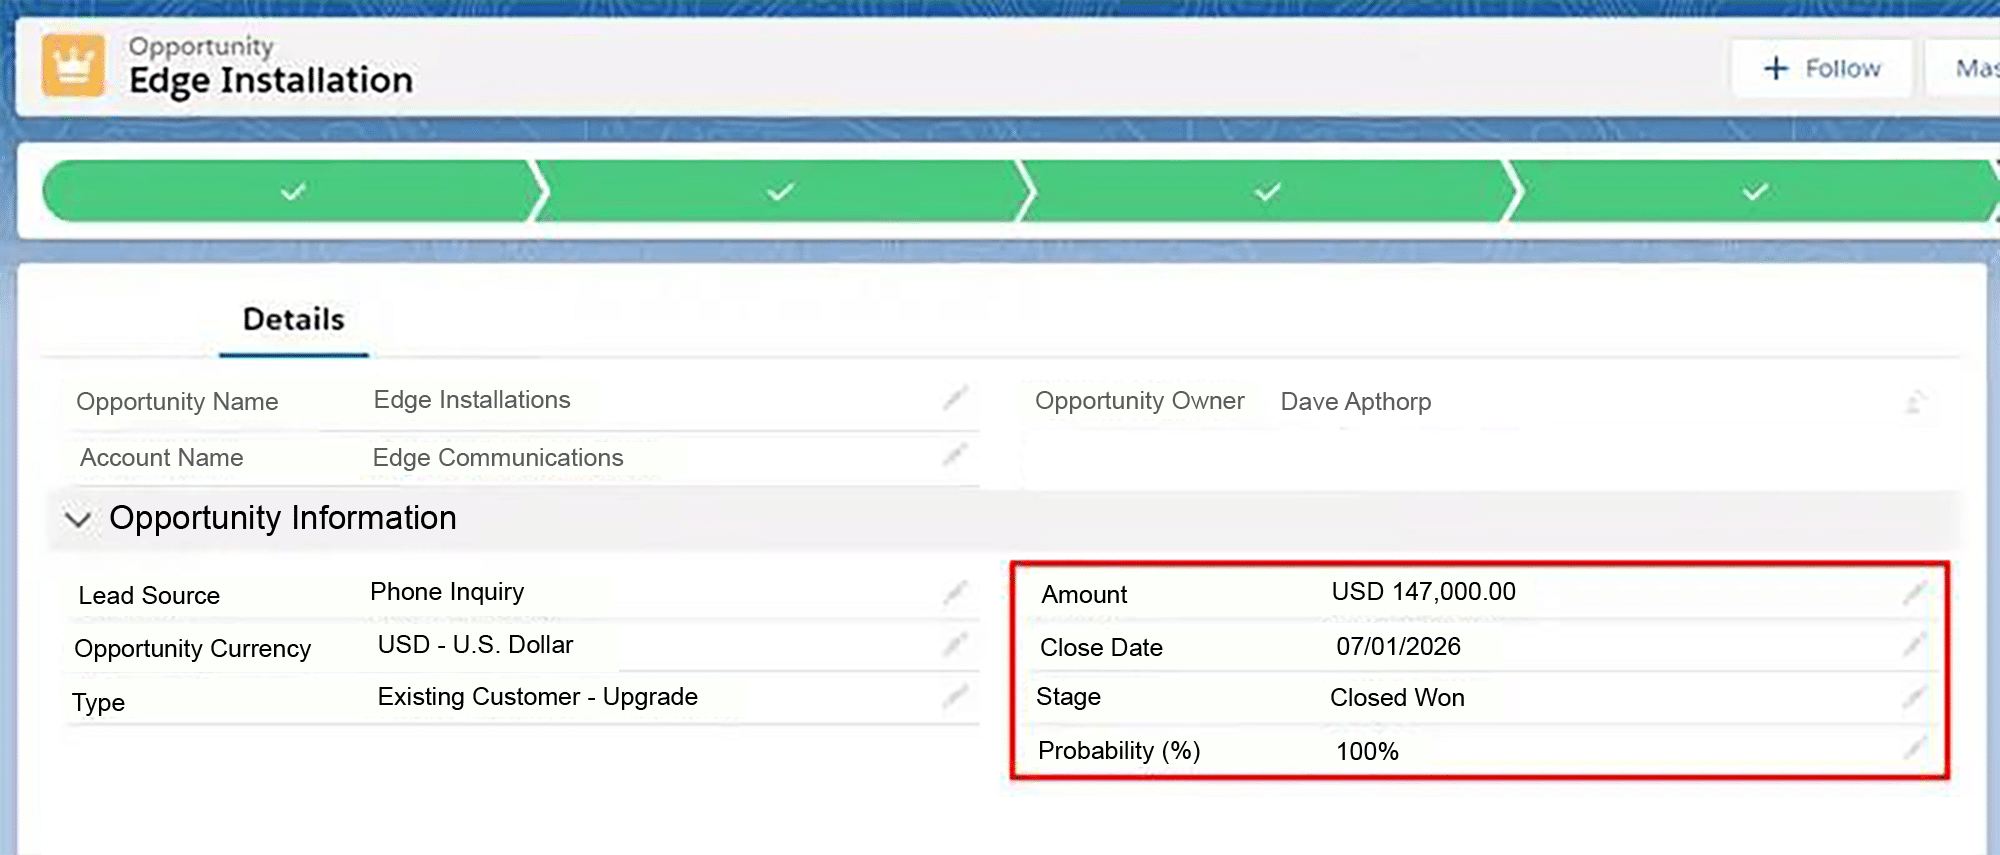
Product schedules in Salesforce are essential if you need to forecast revenue over time. That’s because when an opportunity is marked Closed Won, it doesn’t necessarily mean the cash hits the bank immediately.
With subscription apps, professional services, warranty contracts, and multi-year agreements, revenue is typically recognised over time - often month by month or tied to specific milestones.
If you only forecast the total booked value of a deal when it closes, you lose visibility into how that revenue will flow over time.
However, GSP provides a solution. If you need to track and schedule opportunity revenue accurately, this article explains the straightforward approach to forecasting revenue over time using product schedules in Salesforce.
Your Guide to Forecasting Revenue Over Time with Product Schedules in Salesforce
Why Do You Need To Schedule Revenue Over Time?
Product schedules in Salesforce help you to spread the total opportunity amount over time. In other words, they allow you to track deal value versus revenue timing and enable future revenue reporting.
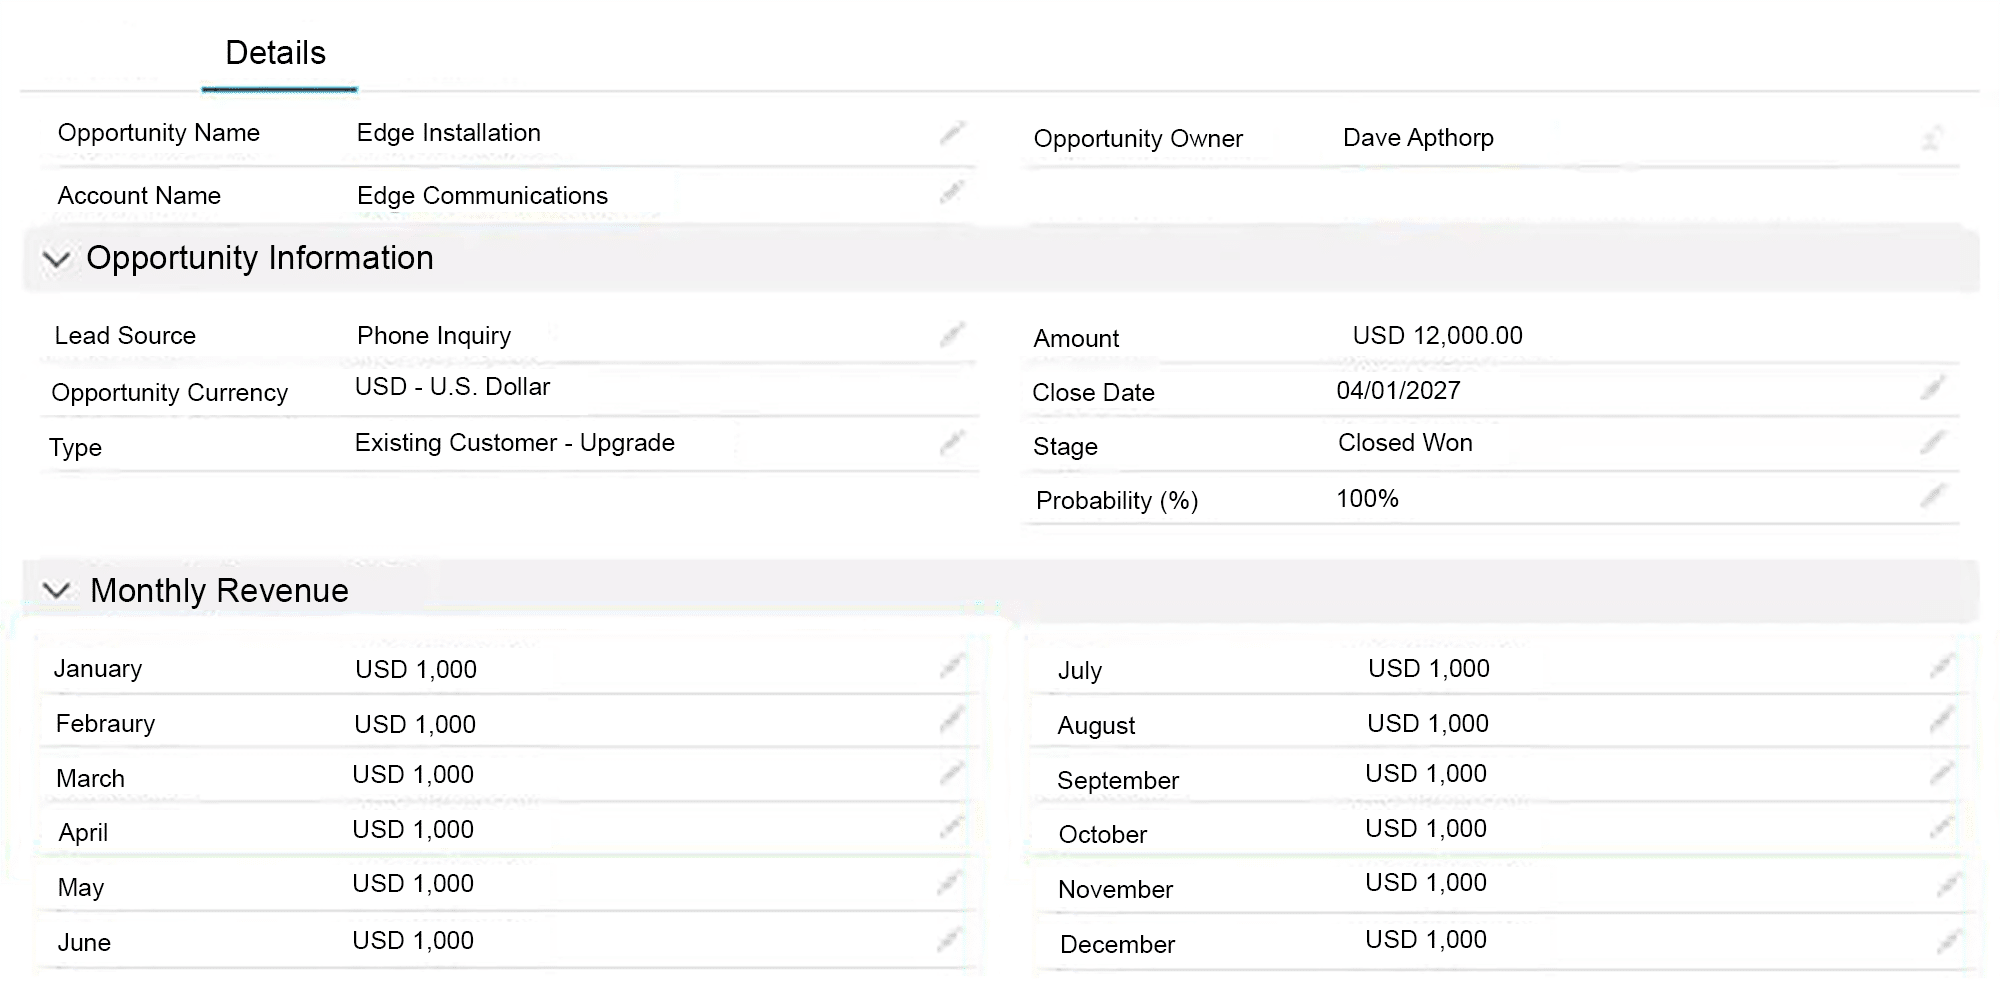
For example, let’s say you win a $12,000 opportunity in April.
However, you don’t receive the $12,000 in April. Instead, the revenue might spread over the following 12 months. It may even be that there’s a lag between the closing month and the start of the income.
Without product schedules, it’s virtually impossible to forecast revenue over time accurately in Salesforce.
Who Needs to Schedule Revenue Over Time?
Many types of companies need to track revenue over time rather than recognizing it all at once. Common examples include:
- Professional services that deliver projects over time.
- Capital equipment items, on which the customer draws down or pays for over a period.
- Support or maintenance contracts that span one, two, or three years.
- Software-as-a-Service (Saas) licenses on fixed-term or open-ended contracts.
- Framework agreements, where you know the customer will buy every month, but with no fixed or guaranteed amount.
How Do You Schedule Revenue Over Time in Salesforce?
There are 4 primary ways to schedule revenue over time in Salesforce. Each approach has its own advantages, limitations, and operational implications for your sales teams, finance, and revenue operations.
Below, we’ll explain how each method works — along with where it performs well and where it may fall short.
- Use the GSP Product Schedules App
- Standard Salesforce Product Schedules
- Create Multiple Opportunity Fields
- Create Separate Opportunities for Each Month
Let’s begin with the quickest, most straightforward, and most scalable option for enabling your salespeople to accurately schedule revenue over time.
Option 1: GSP Product Schedules App
GSP Product Schedules is available on the Salesforce AppExchange and was explicitly designed to solve the challenge of scheduling revenue over time accurately in Salesforce.
Unlike the other 3 options, GSP Product Schedules:
- Is quick and easy for reps to use: its clean, intuitive interface means there’s no clunky line-by-line product setup and no awkward post-entry steps.
- Provides flexible scheduling options: includes a variety of schedule templates and enables salespeople to reflect ramp-ups easily.
- Makes it easy to compare scheduled revenue with targets: track time-phased revenue against the current month quota, upcoming quarter targets, and annual objectives.
- Automatically updates when opportunities change: there’s no manual rework, no revenue distortion, and no hidden admin burden.
- Enables powerful time-based reporting: report on revenue over time by product, territory, salesperson, region, and any custom fields for genuine forward visibility.
If your revenue accrues over time, your forecasting system must reflect that reality. With GSP Product Schedules, you transform Salesforce into a real-time phased forecasting engine, without added complexity or spreadsheet dependency.
The following are just some of the essential features included as standard in GSP Product Schedules:
- Schedule parameters (# Schedules and Start Date): enter these at the same time as adding products to the opportunity.
- Schedule templates: select from straight-line, s-curve, pro-rated by month, or pro-rated by day.
- Manual adjustments: allow salespeople to fine-tune schedules easily to reflect deal specifics and incorporate ramp-ups and trial periods easily.
- Automation: revenue updates automatically when you schedule by quantity, and the schedules immediately shift when the Close Date changes.
- Reports and dashboards: gain full visibility into scheduled revenue and quantity and compare scheduled versus actual revenue to ensure you don’t leave money on the table.
This short video provides an over GSP Product Schedules in action.
Does Your Revenue Forecast Fall Apart When Deals Slip?
Book a free 45-minute demo. Tell us your biggest revenue scheduling headache scheduling. We’ll show you exactly how GSP Product Schedules keep your forecast accurate automatically.
Free Product Schedules Demo · 45-Minute Video Call · You Set the Agenda
Option 2: Standard Salesforce Product Schedules
Alternatively, you can use standard product schedules in Salesforce. Here, the salesperson adds one or more Products to an opportunity in the usual way, before creating a Schedule for each product line item. They do this by clicking on each product line item, then on the Establish button.
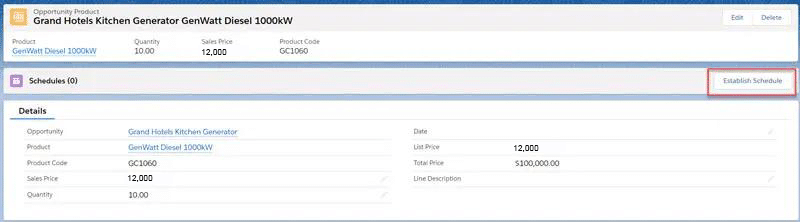
The Establish button opens a pop-up to enter the schedule details for the opportunity product.
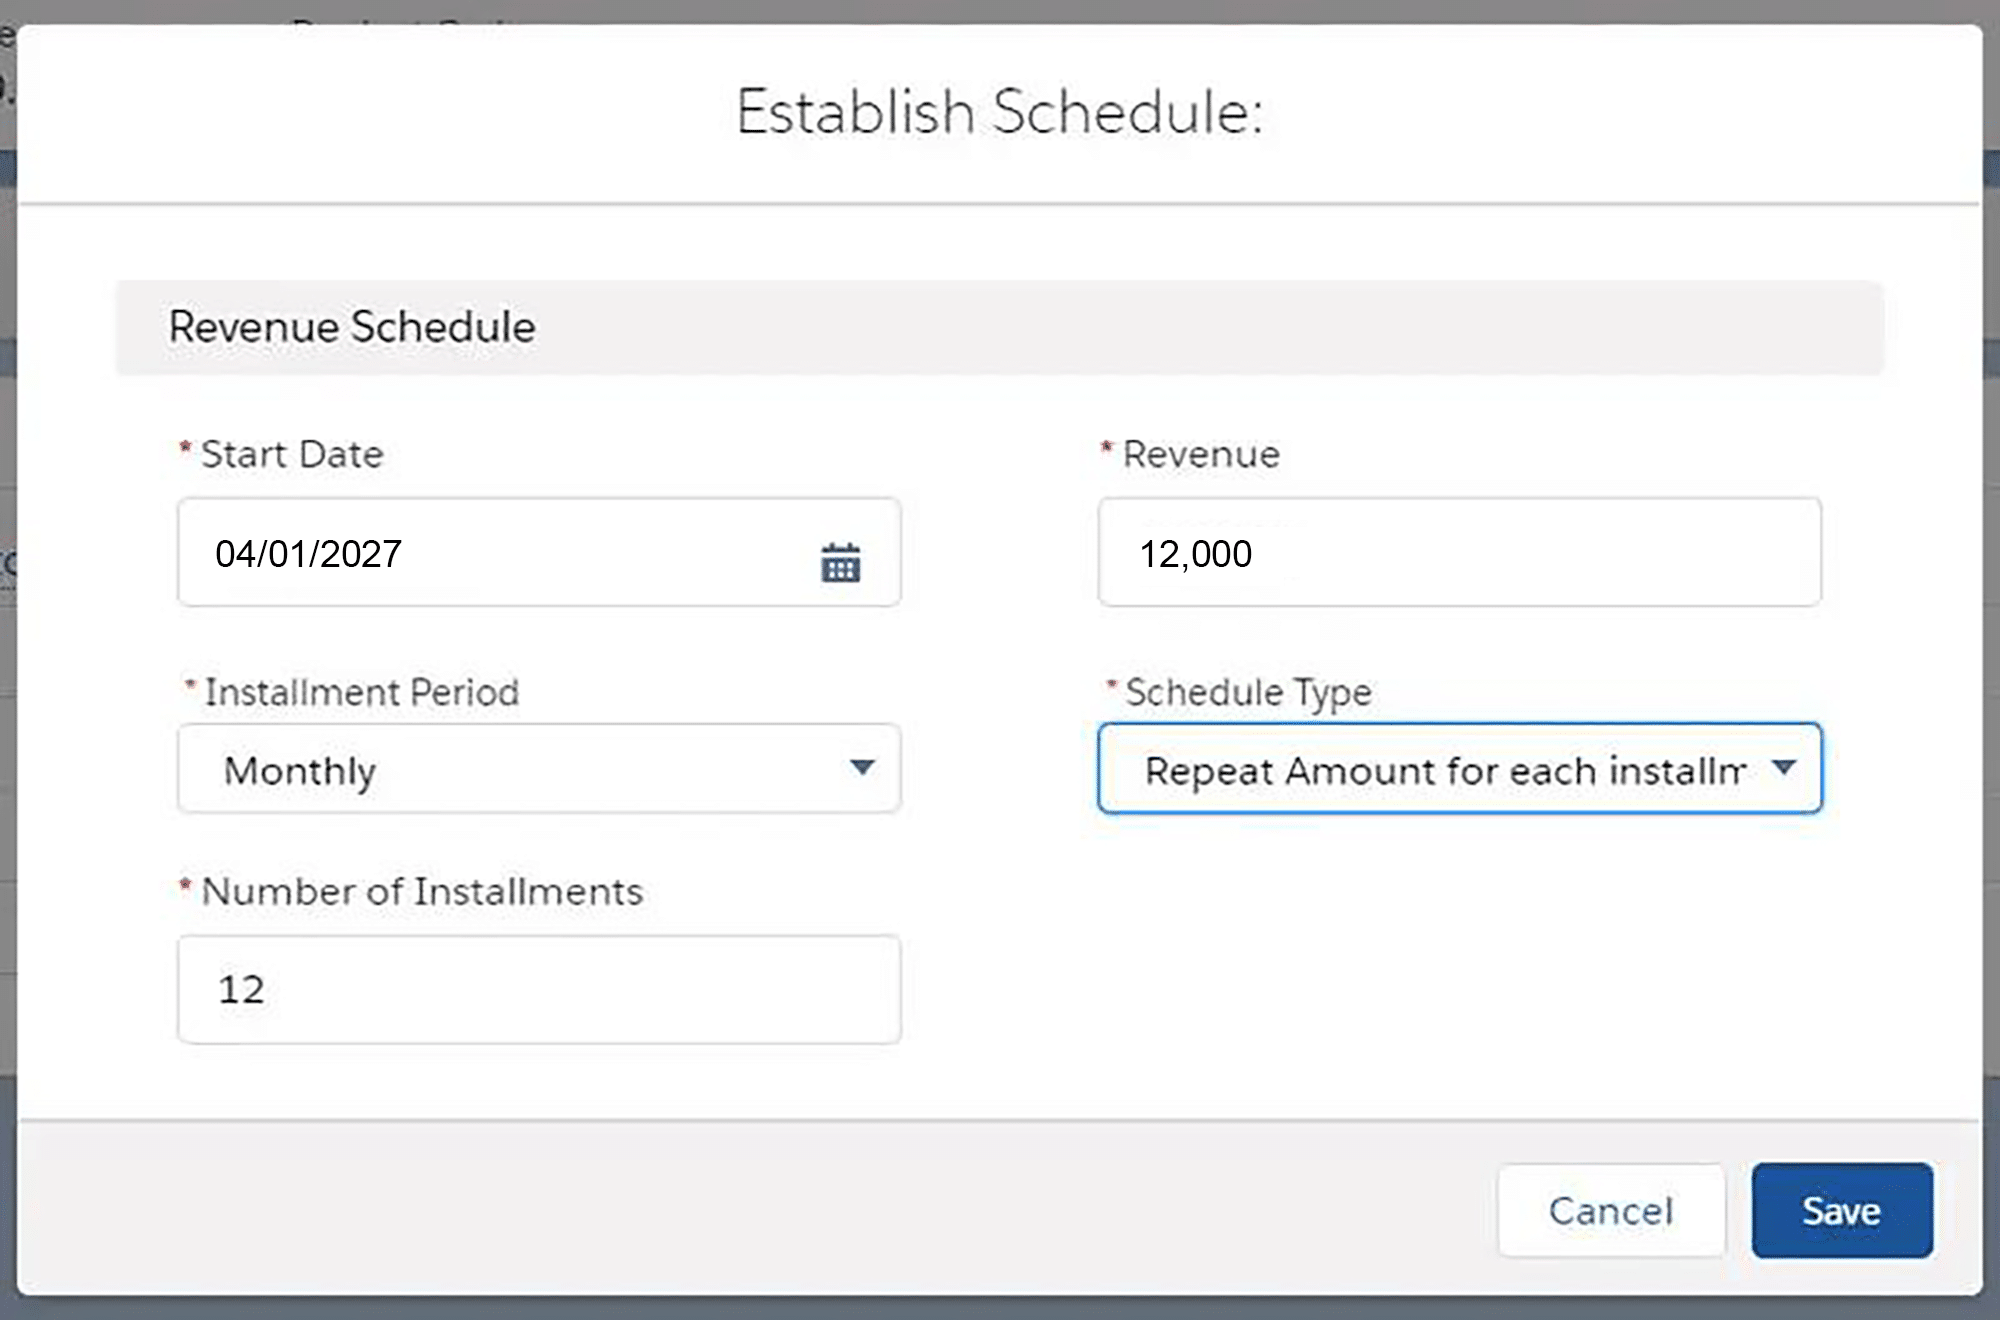
Unfortunately, it’s a manual, time-intensive task, because the salesperson must repeat this process for every other product on the opportunity. There are also other limitations. For example, schedules do not automatically update when the Close Date changes, meaning more manual work for salespeople for revenue forecasts to stay aligned with deal dates.
That said, for some organizations, standard product schedules in Salesforce offer advantages:
- Available out-of-the-box: there’s no need to purchase or install a third-party application, which can be appealing for some companies.
- Reporting and Dashboards: view revenue by month or period and include scheduled revenue in management reporting.
Option 3: Create Multiple Opportunity Fields
Still using standard Salesforce functionality, you can schedule revenue over time by creating multiple fields on an opportunity to store the revenue amount for each quarter or month.
This approach is always a mistake. It’s almost impossible to produce meaningful reports and dashboard charts, because you are adding data from multiple fields to get a total for the year. Also, it significantly reduces usability, due to the time required to enter the data.
Option 4: Create Different Opportunities for Each Month
For example, let’s say you have a framework agreement with a customer and each month they place a new order. With this option, you must create a fresh opportunity each month to record the revenue.
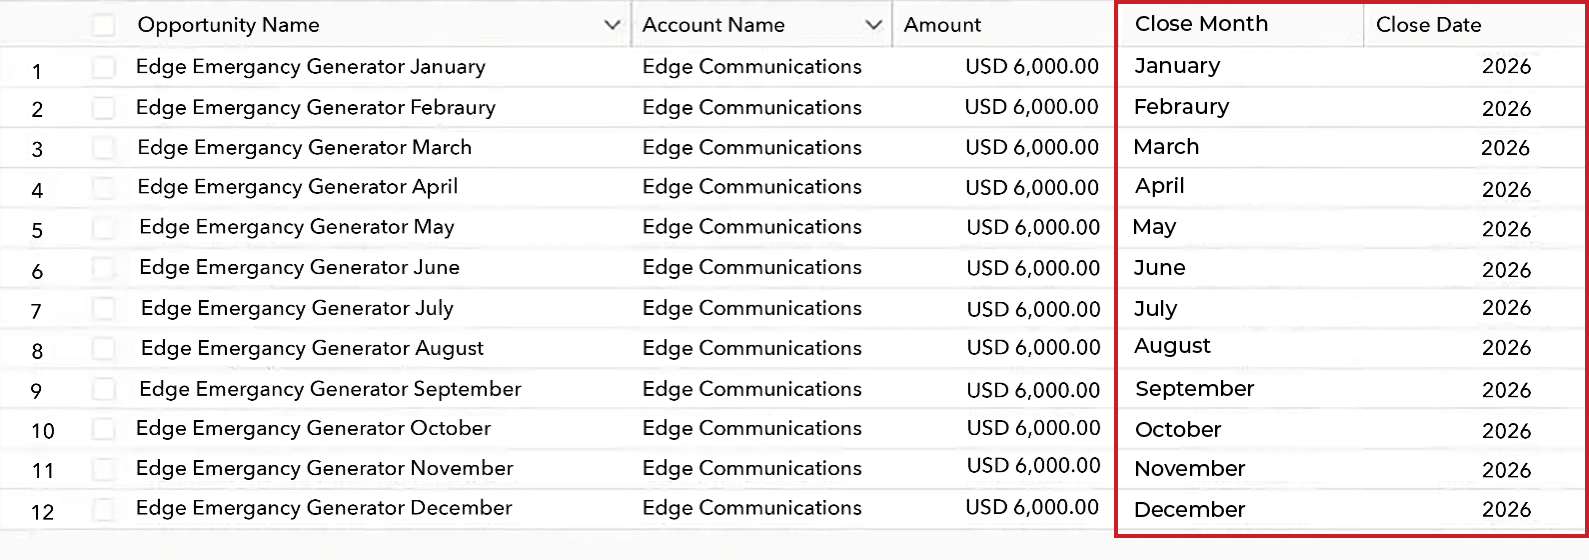
As you can see, there’s much work to create and update the opportunities. Unsurprisingly, it often gets forgotten about, and that’s going to distort reports that track your win rate and average deal size.
Which Option Best Supports Future Revenue Reporting?
To determine which solution best supports your future revenue reporting, consider the following questions:
How Do I Schedule Revenue Over Time?
- Standard Product Schedules in Salesforce: Limited visibility into upcoming revenue can restrict accurate forecasting.
- GSP Product Schedules: Includes a comprehensive set of reports and dashboards charts for tracking revenue over time.
How Do You Measure Scheduled Revenue by Product Target?
- Standard Product Schedules in Salesforce: Comparing scheduled revenue to product targets is not a feature in standard Salesforce.
- GSP Product Schedules: Enables tracking of scheduled revenue against product, team and individual targets including comparisons of won and pipeline scheduled revenue against monthly, quarterly, and annual goals.
What Happens if the Close Dates Moves?
- Standard Product Schedules in Salesforce: Salespeople must manually update each opportunity product schedule when the close date changes.
- GSP Product Schedules: Schedules automatically adjust when the close date changes, eliminating manual rework.
How Important Are Different Schedule Templates?
- Standard Product Schedules in Salesforce: Straight-line is the only scheduling option.
- GSP Product Schedules: Includes templates for straight-line, s-curve, pro-rata by month, and pro-rata by day.
How Do We Handle Ramp Deals in Salesforce?
- Standard Product Schedules in Salesforce: Requires Revenue Cloud.
- GSP Product Schedules: Salespeople can forecast the revenue and manually adjust the ramp up period based on their knowledge of the specific deal.
How to Simplify Salesforce Revenue Scheduling
The video further up this article provides a short overview of GSP Product Schedules in action.
The following set of videos is designed to show you how the critical features of GSP Product Schedules make Salesforce revenue scheduling simple.
4 Schedule Templates to Spread Revenue Over Time
To handle partial months or pro rata revenue in Salesforce, the app includes 4 revenue scheduling templates –straight-line, s-curve, pro-rata by month, pro-rata by day. The following video shows each in more detail.
How to Make Quantity Schedules in Salesforce Easy
The following video demonstrates how GSP Product Schedules supports quantity scheduling in more detail.
How to Compare Scheduled Revenue to Quota
GSP Revenue Schedules supports tracking of scheduled revenue or quantity versus quota at the rep, team, company, and product levels. It does this for scheduled revenue on won and pipeline opportunities. The following video shows you how.
Get started with GSP Product Schedules Now
To start a free trial of GSP Product Schedules, visit the AppExchange and activate your 14-day free trial. If you have any questions, or would like a member of our team to provide a step-by-step walk through, simply contact us – we’re always happy to help get up and running quickly.
Product Schedules in Salesforce: FAQs
Multi-year contracts should only be split into separate opportunities if the revenue is not guaranteed each year. For example, if the customer is committed to a three-year contract, the deal value is for the full three years, and product schedules define how the revenue will accrue over time. However, with many framework agreements, the customer is not obligated to buy products and services in years two and three, meaning that you need repeat opportunities for each of these years.
Do You Have Visibility of Revenue Over Time in Salesforce?
Book a free 45-minute demo. Tell us how you currently track scheduled revenue — we'll show you exactly how GSP Product Schedules gives leadership and operations the accurate forecasting they need, inside Salesforce.
Free Product Schedules Demo · 45-Minute Video Call · No Sales Pressure