How To Compare Your Sales Funnel With Quota In Salesforce
Learn how to know if your funnel's ready to smash your sales targets.
Last updated June 10, 2026


Download the 12 Must-Have Charts for Your Salesforce Dashboard eBook today!
Many managers that use salesforce are still not gaining the sales funnel insight they expected.
In particular, they want to know much more about how the sales funnel compares with their quota.
Sure, they’ve got salesforce dashboards set up. These give visibility of the sales funnel and sales performance. But its still a challenge to create a robust sales forecast.
That means they can’t use salesforce to get a definitive answer to that most fundamental of questions.
Is my sales funnel big enough to make my quota?
But it’s worse than that:
Knowing you’ve enough sales funnel to make your quota for this month is one thing.
However, what if the sales funnel only contains early-stage Opportunities? Deals that may take two or three months to close. How confident can you be then of achieving this months’ quota?
Fortunately there’s a sure-fire way to using Salesforce to know whether you’ve enough sales funnel – of the right type – to meet your sales quota.
Not just the quota for this month.
The quarter’s sales quota too. Indeed, businesses that track the sales funnel in salesforce in the way we describe here, get a clear picture of how likely they are to achieve annual, quarterly and monthly revenue targets.
Here’s how it works. And when you’re done watch the accompanying video.
Monthly Sales Quota
First you need a new custom object and a new tab. Let’s call it Monthly Sales Target, although it doesn’t really matter how it’s named. If Monthly Sales Quota, Revenue Objective or Monthly Sales Forecast make more sense in your business, that’s fine.
The Monthly Sales Target stores the sales quota for each sales person for each month. There’s a record in salesforce for each sales person for every month of the year. If you track performance against quota on a quarterly, rather than monthly basis, that’s fine. There’s simply going to be four records per sales person per year, rather than 12.
The ‘Month’ and ‘Year’ fields on the Monthly Sales Target tell us the time period to which the quota relates.
Here’s the most important field, Sales Target. This is the target or quota for the sales person for that month. Every month may have the same Sales Target figure, or they can vary to reflect seasonal trends. It’s up to you.
Compare Sales Funnel to Monthly Sales Quota
Here’s how you know whether there’s enough sales funnel to meet the Sales Target figure.
You need some code that automatically links each Opportunity to the relevant Monthly Sales Target. You can either build the code yourself or you can purchase our pre-built target tracker app.
Here’s what the code does.
It looks at the Opportunity Owner and the Opportunity Close Date. Then it links the Opportunity to the Monthly Sales Target that matches the Owner and the From / To dates.

If the Close Date subsequently changes, then the code ‘unhooks’ the Opportunity from that particular Monthly Sales Target and links it to a new one.
Sales Funnel Metrics
Next, the code ‘rolls-up’ the value of all Opportunities to the Monthly Sales Target.
Critical metrics on the Monthly Sales Target help you understand whether you’ve enough sales funnel to meet your revenue quota. These include:
- Won Amount. The value of all Opportunities that have an Opportunity Stage of Closed Won.
- Funnel Amount. The value of all Opportunities in the sales funnel.
- Weighted Sales Funnel. The value of all Opportunities in the sales funnel, based on the Expected Amount (the Opportunity Amount multiplied by the Probability).
- Expected Revenue. The value of Closed Won Opportunities plus the Weighted Sales Funnel.
In many businesses, this last one is a killer metric.
Expected Revenue
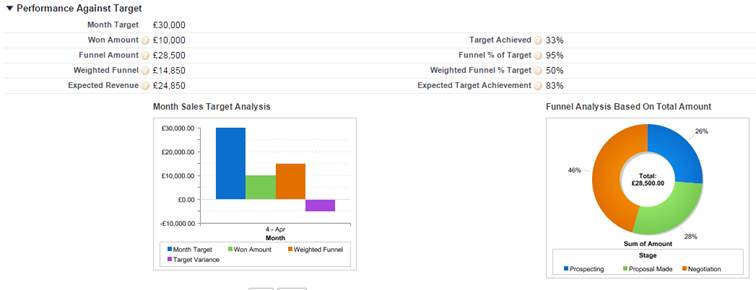
The Expected (or Weighted) Revenue figure shows whether this sales person has enough sales funnel, combined with the business they’ve already closed, to meet their sales quota.
In our example above, the month target is £30,000, but the Expected Revenue is just under £25,000. We don’t have enough! This is emphasized in the percentage figures on the right. The embedded chart also shows a shortfall in the sales funnel compared to quota.
But there’s more to it than that.
Sales Funnel Shape
Look at the chart to the right of the salesforce page. It provides more detail on the sales funnel Opportunities associated with this Monthly Sales Target record.
Look at the Monthly Sales Target for the current month. Let’s say your deals typically run through a 90-day sales cycle. That means you don’t want to see many deals forecast to close this month, in the Prospecting Stage. It’s likely these deals aren’t going to close in the current month.
On the other hand, if it’s the Monthly Sales Target for three months’ time, then look at the sales funnel shape. Lots of early-stage funnel Opportunities due to close in three months is probably a good thing.
Sales Funnel Dashboard
However, what about the company or team-level sales target?
Here’s how we find out if the sales funnel is big enough to meet these revenue targets.
The dashboard chart and underlying report give us that information. And using Expected Revenue, the reports give us a robust sales forecast. One that will stand up to detailed scrutiny.

Of course, none of this replaces the need for proper sales funnel management.
The Opportunity Probability still needs to be reliable on each deal. However, it does give the sales manager the tools necessary for effective sales funnel management.
This is especially the case if the Monthly Sales Target reports are used in conjunction with other salesforce dashboards and reports that identify the poor quality deals. These are the deals that over-inflate your sales funnel. Weed out the lame ducks that give a false sense of future revenue.
And finally, get in touch today if you’d like to test drive our Target Tracker app for yourself. Here's a short introduction to the app:
Watch me demonstrate the Salesforce funnel management solution described in this blog in this video.
Still Tracking Sales Targets in a Spreadsheet?
Book a free 45-minute demo. Tell us how you currently track targets — we'll show you exactly how Target Tracker solves it, no sales pressure.
Free Target Tracker Demo · 45-Minute Video Call · You Set the Agenda