The Best Way to Track Sales Targets in Salesforce
Discover How GSP Target Tracker Brings Visibility and Control to Quota Tracking and Sales Target Reports in Salesforce.
Last updated June 10, 2026


Download the 12 Must-Have Charts for Your Salesforce Dashboard eBook today!
If you can’t accurately measure your teams’ sales performance versus quota and pipeline coverage against target, you’re flying blind.
On the other hand, with precise metrics and timely sales target reports in Salesforce, the outcome changes dramatically. Businesses that set quotas and track sales progress are significantly more successful, with one recent study finding over two-fifths of these companies hit ALL their business goals.
150k+ organizations worldwide use Salesforce to help drive results for sales, service, and marketing, and Salesforce has been ranked the #1 CRM provider for 12 consecutive years. However, as many executives have discovered, accurately measuring sales targets and pipeline coverage in Salesforce can be more challenging than it should be.
Previously, we considered four different ways to measure sales targets in Salesforce, including the dashboard gauge, Salesforce forecasting, and the Lightning home page quarterly performance chart. However, these can be overly complex and don’t consistently deliver the insights sales leaders need to make confident decisions.
Therefore, in this article, we take a deep dive into the best way to track sales quotas in Salesforce: GSP Target Tracker.
Offering clear visibility of sales performance at the individual, team, product, and company level, GSP Target Tracker gives you the pipeline quality metrics, funnel visibility, and sales performance metrics you need to gain clarity, drive revenue, and stay on course to hit your number.
Your Complete Guide to Managing Sales Quotas in Salesforce
How Do I Measure Sales Against Target in Salesforce?
GSP Target Tracker adds the missing ‘Target’ tab to your Salesforce environment, making it easy to track performance against quota at the salesperson, team, company, and product levels.
Fully automated with no extra work for reps, it provides clear visual insights into pipeline coverage and quota attainment. The following video shows a brief overview of how GSP Target Tracker operates in Salesforce to help you measure sales against target.
How Do You Measure Salesperson Quotas in Salesforce?
If you’re struggling to measure sales versus quota or pipeline coverage against sales quotas in Salesforce, GSP Target Tracker makes gaining oversight of this crucial information extremely simple. The following video shows you how salesperson targets work in the app:
If you’re struggling to measure sales versus quota or pipeline coverage against sales quotas in Salesforce, GSP Target Tracker makes gaining oversight of this crucial information extremely simple. The following video shows you how salesperson targets work in the app:
Let’s work through an example together:
Example: Measuring Salesperson Quotas in Salesforce
Imagine Dave Apthorp is a sales rep at Pyramid Construction. Here we can see his sales targets in Salesforce for February:
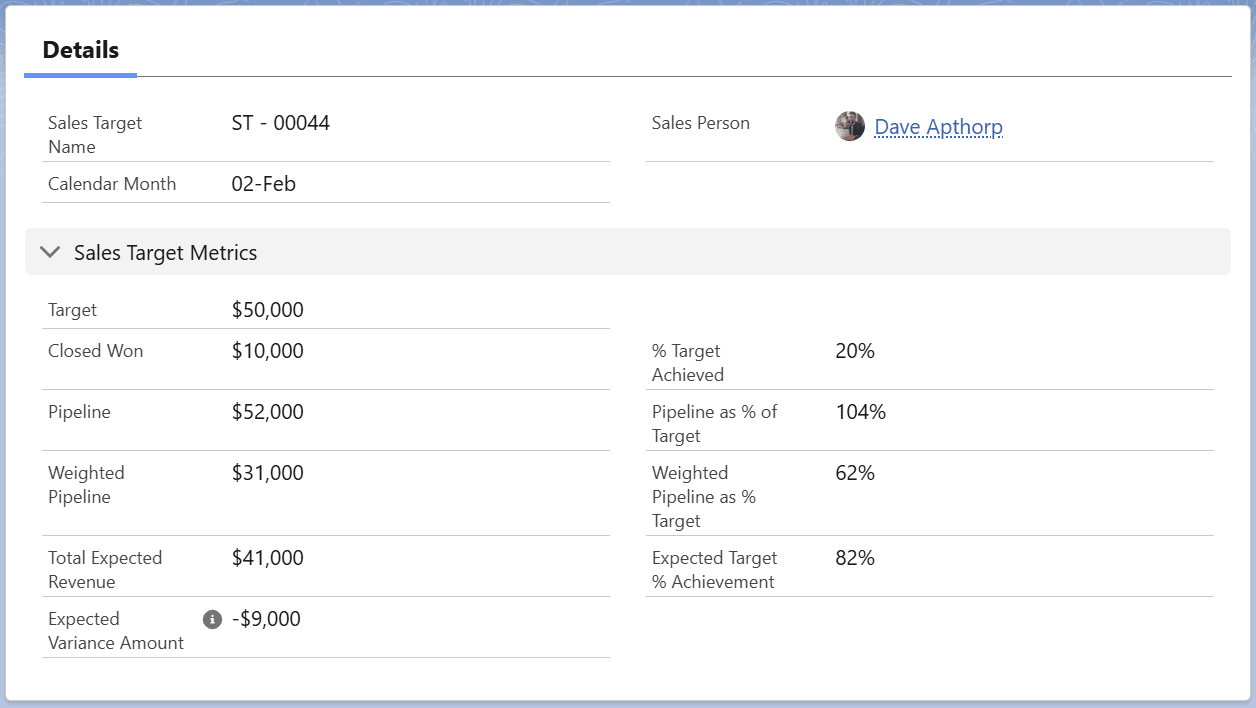
Dave’s quota for this month is $50,000. So far, he’s won $10,000 and achieved 20% of his target.

But what about his pipeline coverage for the month?
Here, we can see Dave’s pipeline for the month is $52,000. On the face of it, that’s good – it’s more than 100% of the target. However, the weighted value of his funnel is $31,000. (The weighted pipeline is the probability of each opportunity multiplied by the amount.)

As a result, Dave’s expected revenue for the month is $41,000. That figure is the sum of his won deals and his weighted pipeline.
What does that mean?
It means it’s likely that Dave does not have enough funnel to hit his target, because his pipeline coverage is too low. The chart on the right shows the negative projected variance against his target.

Beneath this graph, a doughnut chart analyzes Dave’s funnel for February:

Dave and his manager should be concerned about this information because over two-thirds of Dave’s funnel for this month is in the ‘qualification’, ‘needs analysis’, and ‘proposal’ opportunity stages.
We need to ask: "Is it realistic that these deals will close this month?"
If the answer is "No", Dave’s sales performance vs target for the month is potentially worse than projected. We’ll discuss how you can quickly identify and weed out unreliable deals shortly.
How Do You Measure Team Targets in Salesforce?
Managing a sales team, you likely want to measure sales performance and pipeline coverage at the individual, team, regional, and company levels. GSP Target Tracker enables you to do this by providing flexibility in how you define your team. Watch how easy it is to manage team targets with GSP Target Tracker in Salesforce:
Example: Measuring Team Targets in Salesforce
Dave is part of the southern team at Pyramid Construction. Here’s what we can see their team targets for February:

Although Dave’s forecast is lower than his target, his team is doing well. As you can see, the team has sufficient pipeline coverage, and most deals scheduled to close this month are at advanced stages in the sales cycle.
Soon, we’ll see how the ‘Sales Target Dashboard’ in Salesforce displays the overall performance of the company.
But before that:
How Do You Measure Product Quotas in Salesforce?
With GSP Target Tracker, measuring product quotas in Salesforce is just as simple as tracking individual and team targets, as the following video demonstrates:
Example: Measuring Product Quotas in Salesforce
The following chart shows Pyramid Construction’s product quota for generators in February:

The sales team has already made significant inroads into the quota, with won opportunities involving generators, and pipeline opportunities still available. It looks like a good month!
Still Tracking Sales Targets in a Spreadsheet?
Book a free 45-minute demo. Tell us how you currently track targets — we'll show you exactly how Target Tracker solves it, no sales pressure.
Free Target Tracker Demo · 45-Minute Video Call · You Set the Agenda
How Do You Link Opportunities to Target Reports in Salesforce?
In a nutshell, you don’t have to. Salesforce opportunities automatically link to target records, which means there’s no additional work for your salespeople.
The app uses three pieces of information to determine which target the opportunity links to:
1. Opportunity Owner: the sales target is for the opportunity owner.
2. Close Date: the opportunity’s ‘Close Date’ is the same as the target month. If the Close Date changes, the opportunity unhooks from the existing target record and re-links to the relevant target.
3. Target Type: this field is optional. In some companies, salespeople have more than one target - for example, different targets for new and existing logo deals.
In all cases, the linked opportunities are at the bottom of the target page. Here are the deals linking to Dave’s February target:

With product targets, it’s the opportunity products (rather than opportunities) that automatically link to targets.
Either way, you can customize the target settings – for example, some companies use quarterly rather than monthly targets.
Let’s briefly examine the pipeline quality metrics we also store about each opportunity.
What Pipeline Quality Metrics Does GSP Target Tracker Use?
Now that we know the opportunities linked to Dave’s February target, we can assess whether it’s realistic to assume these deals will all close within the month.
There are three metrics GSP Target Tracker calculates for each opportunity.
1. Number of Close Date Month Changes: this metric automatically calculates the number of times an opportunity has slipped from one month to another.
2. Days Open: this metric counts the number of days the opportunity is open. The metric stops counting when the salesperson sets the deal to ‘closed won’ or ‘lost’.
3. Days Since Last Stage Change: this metric tracks the number of days since the last change in the opportunity stage.
We can see these critical pipeline quality metrics for an opportunity linked to Dave’s February target:

For example, this opportunity in ‘needs analysis’ has been open for 180 days. Dave updated the stage 122 days ago, and the deal has slipped four times. This information suggests that we will likely be skeptical about the deal closing successfully this month. If we want more information, we can click on the Opportunity Name and drill down to the opportunity.
How Do Sales Target Report Dashboards Work in Salesforce?
GSP Target Tracker includes sales target report dashboards, which detail quota performance and pipeline coverage by salesperson, team, product, and the overall company.
For example, look at the top two rows of the ‘salesperson target dashboard’. These rows summarize performance versus target for this month.

You can see:
- Performance against quota for all salespeople.
- Breakdown of the pipeline by month.
- Per-salesperson performance.
You can also use a filter at the top of the dashboard to zone in on each salesperson. And there’s a similar row for next month, this quarter, and this year.
As you can imagine, the teams, product, and company-level dashboards feature charts that provide this powerful insight. And, of course, you can drill down on any chart to view the underlying data.

The dashboards also contain win rate analysis charts, which compare the ratio of won to lost deals over a period. And what about the day-to-day reporting needs of first-line sales managers? GSP Target Tracker also includes the ‘sales manager dashboard‘.
What Opportunity Conversion Rate Metrics Do Target Reports in Salesforce Show?
Conversion rates are significant because they help you identify sandbagging and waterlogging. Controlling these trends is essential for accurate and reliable pipeline coverage metrics. GSP Target Tracker provides valuable opportunity conversion rate metrics in Salesforce, allowing you to compare the ratio of deals won to opportunities lost during the period. Here’s an example:

As you can see, Dave’s opportunity win rate in Salesforce is 29% by record count and 45% by value.
But what does this mean?
Dave is successfully winning a higher proportion of large-value deals. We know this because his win rate by value is higher than his win rate by record count.
Is it Possible to Customize GSP Target Tracker in Salesforce?
GSP Target Tracker makes setting up targets in Salesforce really simple – in just a few clicks, you and your team will be up and running with complete visibility of your sales target reports and pipeline coverage.
Customizing the GSP Target Tracker to suit your organization’s specific needs is also straightforward. You can:
- Apply quarterly or annual sales targets instead of monthly.
- Use a custom field that represents the value of an opportunity instead of the amount.
- Exclude certain types of opportunities from linking to target records.
- Modify the reports and dashboards based on your sales structure.
Ready to Improve How You Manage Sales Quotas in Salesforce?
Why not install GSP Target Tracker from the AppExchange and try it for yourself? You’ll get access to a 14-day free trial to experience the tool in your sandbox or production environments – and if you have any questions at any point, you can contact us to talk to a member of our team.
Sales Targets in Salesforce: FAQs
Whether you set monthly, quarterly, or annual quotas depends on the length of your sales cycle. However, monthly targets are a good starting point for many companies, including those with a long sales cycle:
- You can summarize monthly targets to get a quarterly or annual view using reports and dashboard charts.
- With quarterly and annual targets in particular, getting off to a bad start may discourage salespeople; using monthly targets allows the rep to reset their effort.
- Monthly targets instil a sense of urgency in sales activities related to closing deals.
- Monthly targets enable greater flexibility in reporting – for example, monthly targets allow you to report on total progress for the first five months of the year.
What to do next
Here are four steps you can take today to learn more about the Target Tracker.
- Arrange a walkthrough. Contact us, and we'll walk you through the Target Tracker and answer your questions.
- Take a Trial. Use the 14-day free trial to experience the Target Tracker in your sandbox or production environments. Again, start by going to the AppExchange Listing.
- Read more about tracking sales versus quota. Here are two great blog posts to start with:
4 Ways To Track Targets in Salesforce.
Measure Pipeline Coverage With Confidence.
Now, over to you.
Do You Have Enough Pipeline to Hit Your Targets?
Book a free 45-minute demo. Tell us how you currently track pipeline coverage — we'll show you exactly how Target Tracker gives you the answer in real time, no sales pressure.
Free Target Tracker Demo · 45-Minute Video Call · You Set the Agenda