How And Why To Measure Opportunity Conversion Rates Correctly
Why opportunity win rates deserve more of your attention - and how to track them.
Last updated June 3, 2026


Download the 12 Must-Have Charts for Your Salesforce Dashboard eBook today!
Increasing your opportunity win rate is one of the most powerful ways to grow revenue.
It's a metric that reflects nearly every aspect of a sales team's performance. However, while the opportunity win rate is highly valuable, it can also be easily misinterpreted, sometimes leading to flawed conclusions and poor decisions.
In this article, we’ll cover:
- The correct way to measure opportunity win rates (and the incorrect way to avoid).
- Best practices for using opportunity conversion rates effectively, including key pitfalls.
- How to report on opportunity win rates in Salesforce.
Let’s start.
Why Measure Opportunity Win Rates in Salesforce?
Having an accurate measure of opportunity win rates allows you to:
- Evaluate performance. Compare how individuals, teams, and territories are performing
- Identify coaching needs. Pinpoint where salespeople may need additional training or support
- Track marketing effectiveness. Assess the impact of marketing and business development efforts on revenue outcomes
- Analyze by segment. Understand how your sales strategy performs across different customer segments
- Allocate resources. Optimize how resources are allocated across your sales and marketing efforts
Next, we’ll look at the correct way to measure deal conversion rates.
How To Measure Opportunity Win Rates?
There is more than one way to calculate opportunity win rates.
Some people incorrectly include the total open pipeline in their win rate calculations. In this approach, the value of deals won during a given period is divided by the total pipeline at the start of that period.
For example, if your total pipeline is $1M and you close $200,000, your opportunity win rate using this method is 20%.
However, this approach is misleading.
Here’s why:
Let’s assume your average sales cycle is three months. If your team generates many early-stage deals this month, those opportunities are unlikely to close for another 2-4 months. Yet in the following month, when your team performs well and closes deals that they created three to four months ago, the win rate appears artificially low because opportunities created in the prior month are included in the denominator, even though they are not yet realistically winnable.
Correct Way To Measure Opportunity Win Rates
The correct way to measure opportunity win rates is to compare the number and value of deals won during a given period against all deals closed in the same period.
For example, if you win 20 opportunities in a month with a total value of $300,000, and lose 30 deals with a total value of $700,000, then your:
- Win rate by value is 30% ($300K/$1m total closed)
- Win rate by count is 40% (20/50 total closed opportunities)
This approach is unambiguous. There’s no need to debate which open deals should be included or excluded, since only closed opportunities are considered. It also ensures that strong pipeline generation in one month does not artificially distort win rates in subsequent months.
Win Rate Dashboard Chart in Salesforce
Here’s an example of an opportunity win rate dashboard chart in Salesforce.

The chart shows the two opportunity win rate metrics:
- Win Rate by Count Percentage. Shown in blue, this is the percentage of deals won in the month, expressed as a ratio of opportunities. In other words, the sales team won 20% of the opportunities closed in December.
- Win Rate by Value Percentage. Shown in green, this is the percentage of deals won in the month in terms of the value of opportunities.
In most businesses, both are important.
We can see in the chart, for example, that in December the Won Amount % is higher than the Won Count %. This information is likely good news. It means the sales team successfully closed higher-value opportunities.
February tells a different story. The Won Count is higher. In other words, we closed a larger proportion of lower-value deals. Now that we have this information, we can start to ask questions about why.
Opportunity Win Rate Report in Salesforce
Here’s the Salesforce win rate report underpinning the dashboard chart (see the FAQs for how to generate the report formulas).
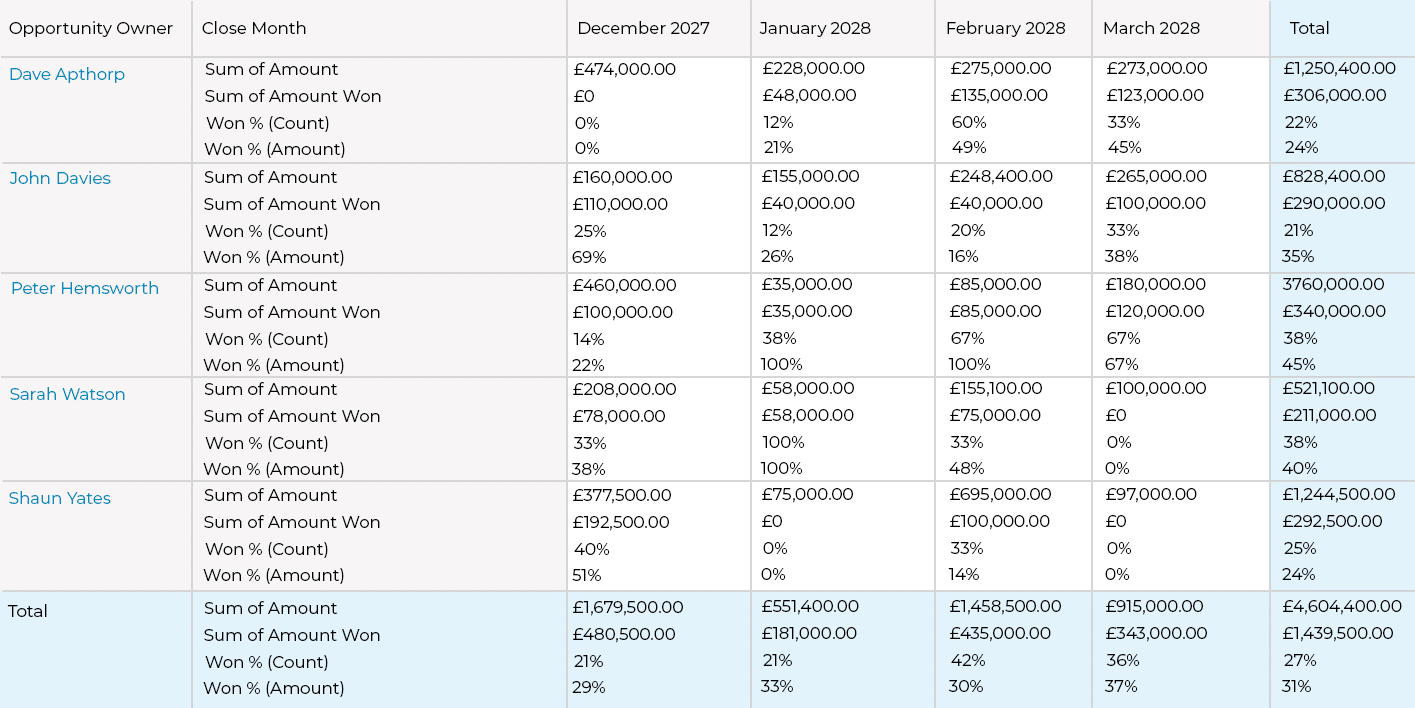
The report gives us significantly more detail on the opportunity win rates by sales rep and month.
For example, look at the figures for Dave Apthorp for March. We can see that Dave has:
- Closed £273,000 of opportunities. This figure combines both closed won and closed lost.
- Won £123,000 in opportunities.
- Consequently, his Won Amount % is 45%.
- The report also shows that Dave’s Won Count % is 33% (calculated from the underlying opportunities that comprise the report).
Analyzing the data by salesperson and month allows us to identify trends across the team. You can adjust the report to compare opportunity win rates across sales territories, customer segments, or other dimensions.
Got a Salesforce Challenge you'd like advice on?
Book a free 45-minute consultation with one of our Salesforce experts. You choose the topic - we'll give you practical, honest recommendations on how to improve.
Free Salesforce Review | 45 Minute Web Meeting | You Choose The Topic
Best Practices for Opportuntiy Win Rate Reports in Salesforce
In our example, Dave has an overall lower win rate than John; 24% compared to 35%. But does that necessarily mean John is performing better?
Not always.
Win rates should be used alongside other metrics before drawing conclusions because overemphasizing win rates in isolation can encourage two types of undesirable behavior:
- Sandbagging occurs when salespeople delay adding opportunities to the pipeline or understate the stage or value of deals. By avoiding early-stage entries or minimizing deal values, win rates can appear artificially high.
- Waterlogging occurs when dormant deals that no longer have legs remain in the funnel. Failing to remove deadwood opportunities artificially boosts deal win rates because there are fewer ‘lost’ deals.
In both cases, pipeline visibility is distorted, and sales forecast accuracy suffers.
Here are five questions you can ask to gauge whether the win rates in the Salesforce report accurately reflect reality.
- Does everyone have the same understanding of when it is appropriate to create an opportunity?
- Do some salespeople habitually pull in surprise deals at month-end?
- Is one team focusing more on new customers than on existing ones?
- Are dormant deals being closed out in Salesforce? (Use pipeline quality metrics to highlight deadwood opportunities.)
- Are some lost deals being undervalued in terms of opportunity size?
These questions, along with others tailored to your sales structure, help provide the context needed to interpret the win rate correctly. With that context, you can make more informed judgments about performance differences, such as whether John is truly outperforming Dave.
How To Get Win Reports in Salesforce?
There is no out-of-the-box opportunity win rate report in Salesforce. However, there are three ways to report on opportunity win rates in Salesforce.
- Build the report yourself. The formula you need for this is in the FAQs at the end of this article.
- Install the GSP Sales Dashboard. This free dashboard has our 12 Must-Have Sales Charts, including a built-out win rate report.
- Install GSP Target Tracker. This Salesforce-native app enables leaders to track sales performance and pipeline coverage versus quota and includes win rate metrics by value and count. Take a look at the short video below:
Opportunity Win Rates: FAQs
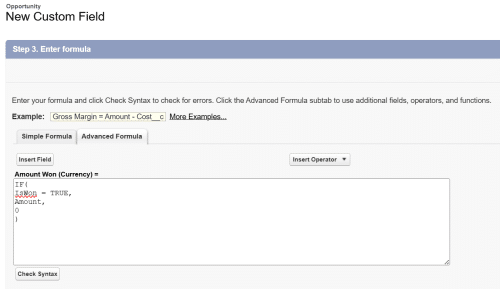
Step 1. Create a custom currency formula field called Amount Won on the opportunity, using this formula:
IF(
IsWon = TRUE,
Amount,
0
)
No need to add the field the page layout but make sure it is visible to all relevant profiles.
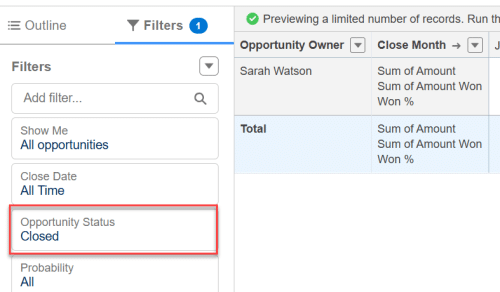
Step 2. Create an Opportunity Report in Salesforce with Opportunity Status set to Closed. Group Rows by Opportunity Owner an Group Columns by Close Month. Use the Amount field in the Columns.
Step 3. Create a formula within the report, dividing Amount Won by the standard Amount field:
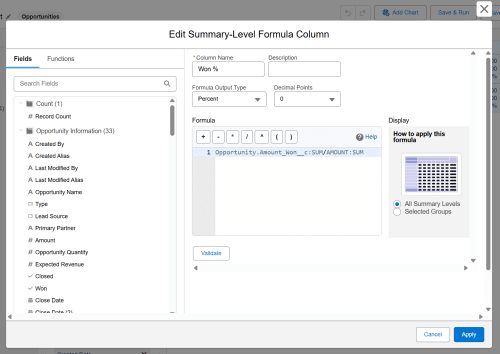
Get in Touch
Do you have questions about maximizing your Salesforce benefits? Or want to book a demo of GSP Target Tracker? Get in touch, and we’ll arrange a convenient web meeting.
Is Your Salesforce Working as Hard as You Are?
Book a free 45-minute review. Bring your biggest challenge — we'll give you straight-talking, actionable advice, no strings attached.
Free Salesforce Review | 45 Minute Web Meeting | You Set the Agenda