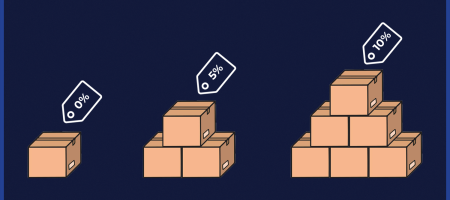
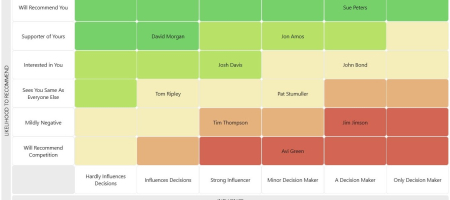
How to Increase Your Revenue by Measuring Sales Velocity

The quicker your sales velocity the more you sell.

At least that’s the theory.

But experience with one of our customers shows this isn’t necessarily the case.

In fact, slowing down during the investigation and discovery stages decreases the overall sales cycle velocity BUT increases win rates.

And that results in increased revenue.

There’s also a great deal more insight on how to manage the sales team by analysing how long opportunities spend in each stage of the sales cycle.

So read about Modernis’ experience in using sales velocity charts and reports in salesforce to discover the full story.

Measure overall sales team velocity

Take a look at the sales velocity chart below. It’s taken directly from the dashboard of one of our customers, Modernis.

The chart shows the average duration of the sales cycle in days.  It compares the time spent at each stage in the sales cycle for Closed Won deals versus Closed Lost opportunities.

Closed Lost opportunities have a shorter sales cycle than Closed Won. This is good news. It means that in Modernis, non-viable opportunities are being qualified-out at relatively early stages in the sales cycle.

In other sales teams we often see the reverse.

In these cases, the sales cycle for Closed Lost deals is significantly longer than Closed Won. But these sales pipelines often contain a disproportionate number of lame duck deals. There are drifting opportunities in the funnel that have long over-stayed their welcome. It’s easy to spot these deals by counting the Number of Close Date changes.

Take another look at the chart or examine the underlying report below. The report shows the Average Time in days for each Stage.

In Modernis the length of time spent on Investigation is significantly different between Closed Won and Closed Deals.

This is deliberate. Time spent uncovering the prospects needs and buying process is viewed as time well spent. It enables the information to be gathered that allows a tailored proposal to be created. Like the hare and the tortoise, quicker is not necessarily better in Modernis.

Individual sales person velocity

But let’s see what else we can learn. Let’s study the sales velocity for selected members of the sales team (the names of the Modernis sales people have been changed in the interests of confidentiality).

The chart shows there’s significant variation in both the length of the sales cycle and the average time spent in each stage.

Dave Apthorp’s sales velocity

Dave Apthorp is the leading sales person in Modernis. He has been for several years. It’s not the first time he’s featured in one of our blogs – The True Story of the Best and the Worst Sales Person on the Dashboard – demonstrates the importance of using more than one metric to assess sales performance.

But let’s look here at the length of Dave’s sales cycle by stage.

Dave Apthorp has the shortest sales cycle. But he has the longest Investigation period – by some distance.

In other words, it Dave is taking more time than any other sales person to understand fully the customer’s needs. This means he can tailor and customise his proposal to align it with the customers’ expectations. And that goes a long way to explain why he has the shortest Proposal and Negotiation stages. Customers see the value in what he is proposing.

Here’s what Dave himself said when we showed him the sales velocity chart. “There are only two secrets to selling. One, qualify your deals. And two – get any objections out and on the table early. It doesn’t mean you have to answer the objection there and then. But get them into the open early so you can work out how to answer them in your proposal.”

And that in my view is the secret to improving win rates, reducing the sales cycle and successfully concluding deals. Ask open ended questions to fully uncover the customers’ issues. And then tailor your proposal accordingly.

So let’s look at what else we can learn by looking at the sales velocity of selected other reps.

Sales Dashboard by GSP

Superb Pipeline Visibility and Sales
Performance Metrics from this free Dashboard.

Shaun Yates’ sales velocity

Shaun is the second highest revenue producer in Modernis over the last 12 months. He’s also got the slowest sales velocity.

Shaun’s deals spend a lot of time in the Prospecting Stage. The Investigation Stage is comparatively short, at least compared to Dave’s.

However, we dug into some of Shaun’s opportunities. We found the level of information he was gathering during Prospecting was far in excess of the other sales people. In other words, he’s effectively doing the Investigation.

When we discussed this with Shaun we made an interesting discovery. His interpretation of what constitutes a qualified opportunity – the difference between the Prospecting and Investigation Stages – was different to everyone else’s.

In fact when you combine Prospecting and Investigation, Shaun is spending nearly as much time as Dave on understanding the customers’ needs, issues and buying process. And now that we’ve clarified the terminology, Shaun is moving his deals into the Investigation Stage earlier in the sales cycle.

Shaun also has the longest Negotiation stage. Shaun and his manager, Jim Peters, think this is because Shaun is relatively inexperienced at closing deals. He’s hesitant to ask for the sale. So Jim has arranged for Shaun to accompany Dave on several sales meetings and has lined up some external training.

So that’s two further benefits of measuring sales velocity. Iron out variations in the understanding of terminology that may be distorting management visibility of the sales pipeline. And identify training needs that will help sales people increase their revenue performance.

John Davies’ sales velocity

John is the third ranked performer on the Modernis team in terms of overall sales volume. His conversion rate is also the lowest – he wins a lower percentage of his opportunities than anyone else.

Let’s look at the average time his deals spend in each stage of the sales cycle.

john Davies sales cycle

Opportunities owned by John and Shaun spend a similar amount of time in the Prospecting Stage. However unlike Shaun, John is quite slow to respond to new Opportunities. We know this from the Activities charts on the sales dashboard.

Is John spending enough time on Investigation? Certainly it’s less than Dave and Shaun (if you include Shaun’s Prospecting stage).

But look at his Negotiation stage. It’s significantly longer than Shaun and Dave.

In addition to having the lowest conversion rate, John’s opportunities experience the greatest number of Close Date changes.

This shows that not only is John slow to qualify new opportunities, he’s not doing a great job of it. In other words, his deals consistently move from one month to the next. That means he’s expending significant amounts of time and energy on deals that are in the later stages of the sales cycle. And many of these deals fail to close successfully.

To improve John’s velocity and revenue, Jim Peters has arranged one-to-one coaching to help John improve his qualification process. Jim is also tracking the speed with which John gets to grips with new deals – and John knows this is a metric on which he is being scrutinised.

Jim has also arranged for John to go on an open-ended questions course to improve his investigation and discovery skills. That will allow him to spend more time on Investigation and do a better job of creating a tailored proposal that genuinely meets the customer needs.

Sarah Watson’s sales velocity

Here’s an interesting one. Have a look at Sarah’s sales velocity and form a view on how her sales volume compares to the other reps.

If you think that Sarah is the lowest overall sales producer then you’re absolutely right.

She’s spending minimal time on Investigation. And a huge amount of time with her deals are in the Proposal stage.

So what can we infer about the way Sarah manages her opportunities? Quite simply she needs to do a lot more work during Investigation and create a more tailored proposal to the customer.

But let’s not jump to too many conclusions too soon. She might not be spending enough time in the early stages – but is that because she feels under pressure from the management team to get the customer proposal out of the door? Is this a management rather than a sales person issue?

Jim tells us that Sarah is the newest member of the sales team although she has worked for Modernis the longest. Her previous role was a technical team leader on the implementation team. Jim is confident she has the knowledge and inter-personal skills to succeed in sales. He’s coaching her to ‘calm down’ and work smarter not faster!

12 Must-Have Dashboard Charts

Our 27 page eBook shows you the 12 killer
Sales Charts for your dashboard.

Popular eBook

ebook-250px-compressed-website

Don’t have time to read the entire Blog Post right now?

No problem.

You can download the entire “Your Sales Forecast Is Probably Wrong” eBook for free by completing the form below!