How To Measure Sales Pipeline Coverage With Confidence
Boards want certainty - this is how to give it to them with a reliable pipeline coverage calculation.
Last updated May 22, 2026


Download the 12 Must-Have Charts for Your Salesforce Dashboard eBook today!
At a Glance
Pipeline coverage compares the total value of your open opportunities for a period with your sales targets – a critical metric for any sales team. While many teams consider a 3x coverage ratio a good rule of thumb, it doesn't always provide a complete picture.
In this article, I'll explain how to calculate weighted pipeline coverage, which offers a more precise, data-driven approach to forecasting revenue, tracking progress, and hitting your quota.
Sales pipeline coverage measures how the total value of your funnel compares to your upcoming revenue targets.
For example, a sales pipeline coverage ratio of 3 means your total pipeline value is three times higher than your quota for that period. In this case, you need to close 33% of the pipeline’s value to meet your sales goal.
Remember, that doesn’t mean closing one-third of all deals – it means closing deals worth one-third of your total pipeline value. Win deals that are above average size, and you need to close fewer of them successfully.
Alternatively, if your sales pipeline ratio is one or less, you don’t have enough funnel to meet your revenue goal. Not even if you win every deal.
Sales managers often focus on this metric at the start of the year or quarter.
However, confidence in the pipeline coverage ratio assumes you have a reliable way to calculate this critical metric. Unfortunately, the approach taken by many companies is flawed or simplistic, or both.
In this article, I’ll explain how to calculate your sales pipeline coverage ratio confidently.
How Pipeline Coverage Is Usually Measured
Here’s how most companies measure pipeline coverage:

The pipeline coverage ratio equals the total value of opportunities due to close in a period divided by the target for the same period.
For example, let's say our sales target for the year is $1 million, and the pipeline for deals closing this year is $3.5 million. Consequently, our pipeline coverage ratio is 3.5.

To calculate the ratio, you need a Salesforce report that measures the total pipeline size. Then divide the value of the funnel by the quota.
Sales Pipeline Coverage Ratios Explained
There's a common rule of thumb that many sales managers apply. The rule states the pipeline coverage ratio should be between 3 and 5.
So, how do we arrive at this number?
Assumptions about the opportunity win rate drive the thinking. For example, if you assume you will win one-third of deals, then the pipeline coverage ratio needs to be at least 3. Likewise, if you expect to win 25% of opportunities, the pipeline coverage ratio must be at least 4.0.
It’s an attractive concept, not least because it’s simple enough to do the calculation in your head often. It’s math that people frequently do in the first week of January.
However, it’s like trying to predict the summer weather on January 1. You might believe it will be a warm year, but too many factors will change before summer arrives.
Likewise, this method of calculating the pipeline coverage ratio is fraught with problems that often make it meaningless when it comes to confidently predicting the achievement of sales targets.
The Problem with Pipeline Coverage Ratios
I often see four common problems in companies that use pipeline coverage ratios to determine whether they have an adequate funnel to meet revenue targets:
- The ratio takes no account of opportunity stages or the customer buying cycle. For example, an extensive pipeline may contain numerous early-stage opportunities with a low likelihood of success. In this case, a high pipeline coverage ratio risks creating a false sense of confidence.
- Hope rather than genuine customer intention or activity exaggerates funnel size. That's because an emphasis on pipeline coverage often means salespeople are under pressure to boost funnel size. Similarly, the pipeline may contain deals that slipped from previous periods and have seen little change in their likelihood of closing successfully. In both cases, your funnel and the pipeline coverage ratio are overstated.
- Measuring the total pipeline size ignores many variances between types of opportunities. For example, it's reasonable to assume a difference in win rates between new and existing customers, business lines, and territories. Failing to differentiate between different types of deals means the pipeline coverage ratio is a very broad-brush number.
- The metric only make sense at the start of a period. For example, partway through the year, when you already have many won deals, you need to carefully compare the remaining quota with open deals that are well-advanced in the buying process.
Pro-tip: This article contains an in-depth assessment of the most common pipeline coverage ratio: The Truth About 3X Pipeline Coverage - and What to Do Instead
With that, you might now be wondering:
Is there a better way to calculate pipeline coverage confidently?
The answer is yes. I’ll show you two methods.
Still Tracking Sales Targets in a Spreadsheet?
Book a free 45-minute demo. Tell us how you currently track targets — we'll show you exactly how Target Tracker solves it, no sales pressure.
Free Target Tracker Demo · 45-Minute Video Call · You Set the Agenda
How to Measure Pipeline Coverage
1. Measure Weighted Pipeline Coverage
With this approach, you calculate weighted pipeline coverage based on Expected Revenue.
Expected revenue is made up of two parts:
- The value of won deals
- The value of the weighted pipeline.
Add these two numbers together, and you have the expected revenue for a period.
To calculate the weighted value for an opportunity, you multiply the opportunity amount by the probability. For example, if the opportunity amount is $50,000, and the probability is 25%, then the weighted value is $12,500.
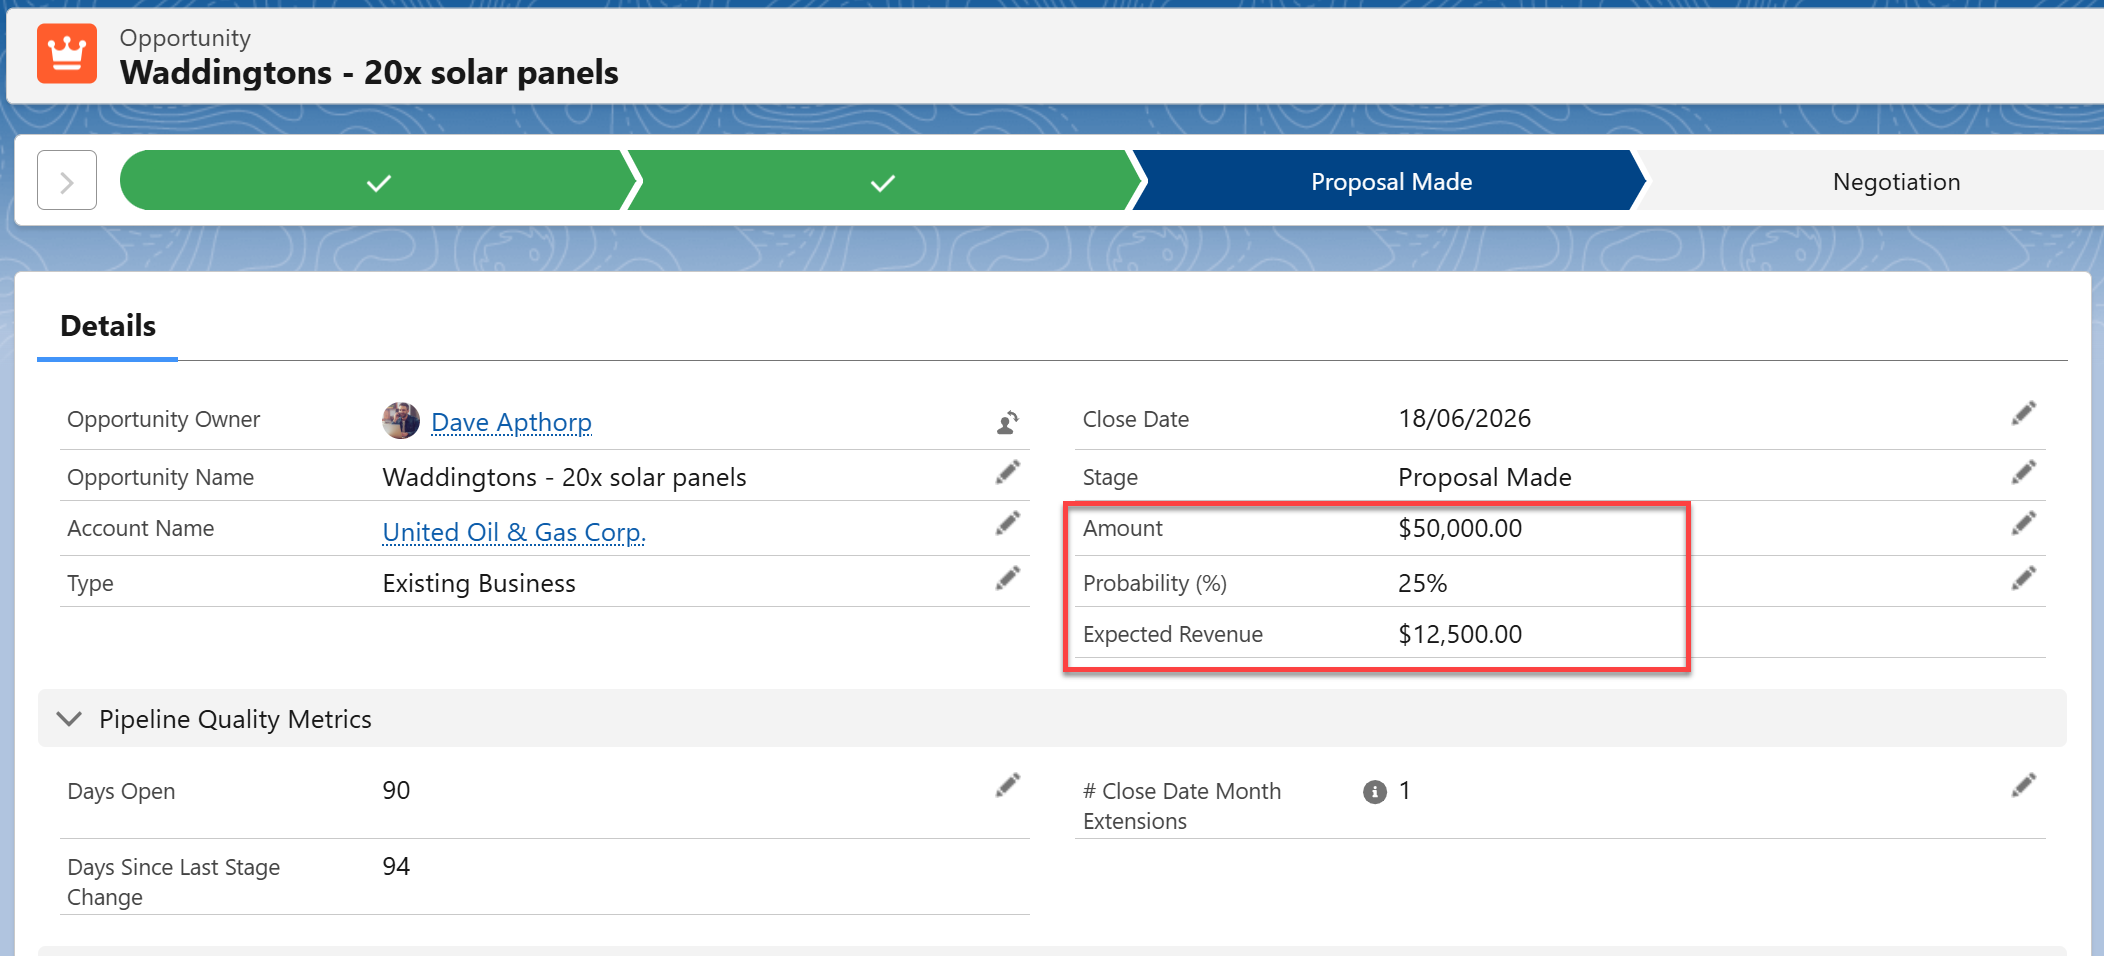
Add up this number for all deals in the funnel, and you have the weighted pipeline.
This method enables us to compare the Expected Revenue with our sales target.

For example, in this case, we can see that the Target for the quarter is $100,000, and we have $40,000 in won revenue.
The weighted pipeline is $70,000. Therefore, we have enough pipeline to meet our sales target.
Using Expected Revenue rather than the pipeline coverage ratio means we are more confident in our assessment. That’s because the weighted pipeline reflects the various opportunity stages.
For example, the figure may include a deal in the negotiation stage at 90% - meaning we are confident it will close successfully. However, deals at the Prospecting or Qualification Stages may be at 10 or 20 percent.
Likewise, opportunities for existing customers may have a higher probability than deals with new prospects. These variances are all reflected in the weighted pipeline.
In other words, the weighted pipeline is a reasonable estimate of the actual revenue we are likely to achieve from open opportunities.
Combining the weighted pipeline with won revenue means that Expected Revenue isn’t valuable only at the start of the period.
For example, if you are halfway through the quarter, the Expected Revenue is a reliable estimate of the likely sales outcome. You can be more confident in this figure than in a simple pipeline coverage ratio.
Pro-tip. Want to dive deeper into this topic? Check out my blog post about best practices for using and applying Expected Revenue:
How And Why Expected Revenue Delivers Reliable Sales Forecasts.
And here’s where you can also get advice on making sure opportunity probabilities are accurate.
2. Measure Pipeline Coverage Using the GSP Target Tracker
The second – and most practical - way to measure pipeline coverage versus quota is to use the GSP Target Tracker. Here’s how it works.
Here’s an example using one salesperson’s target – in this case, we’re looking at Dave Apthorp’s target for September:
Now let’s take a closer look at the numbers above and how the app measures pipeline coverage against Dave’s quota.
Prefer to watch? This video demonstrates how to measure individual salesperson targets using the Target Tracker:
We can see that Dave’s target is $50,000. He’s already won $20,000 this month. The value of his pipeline, which is due to close in September, is $60,000.
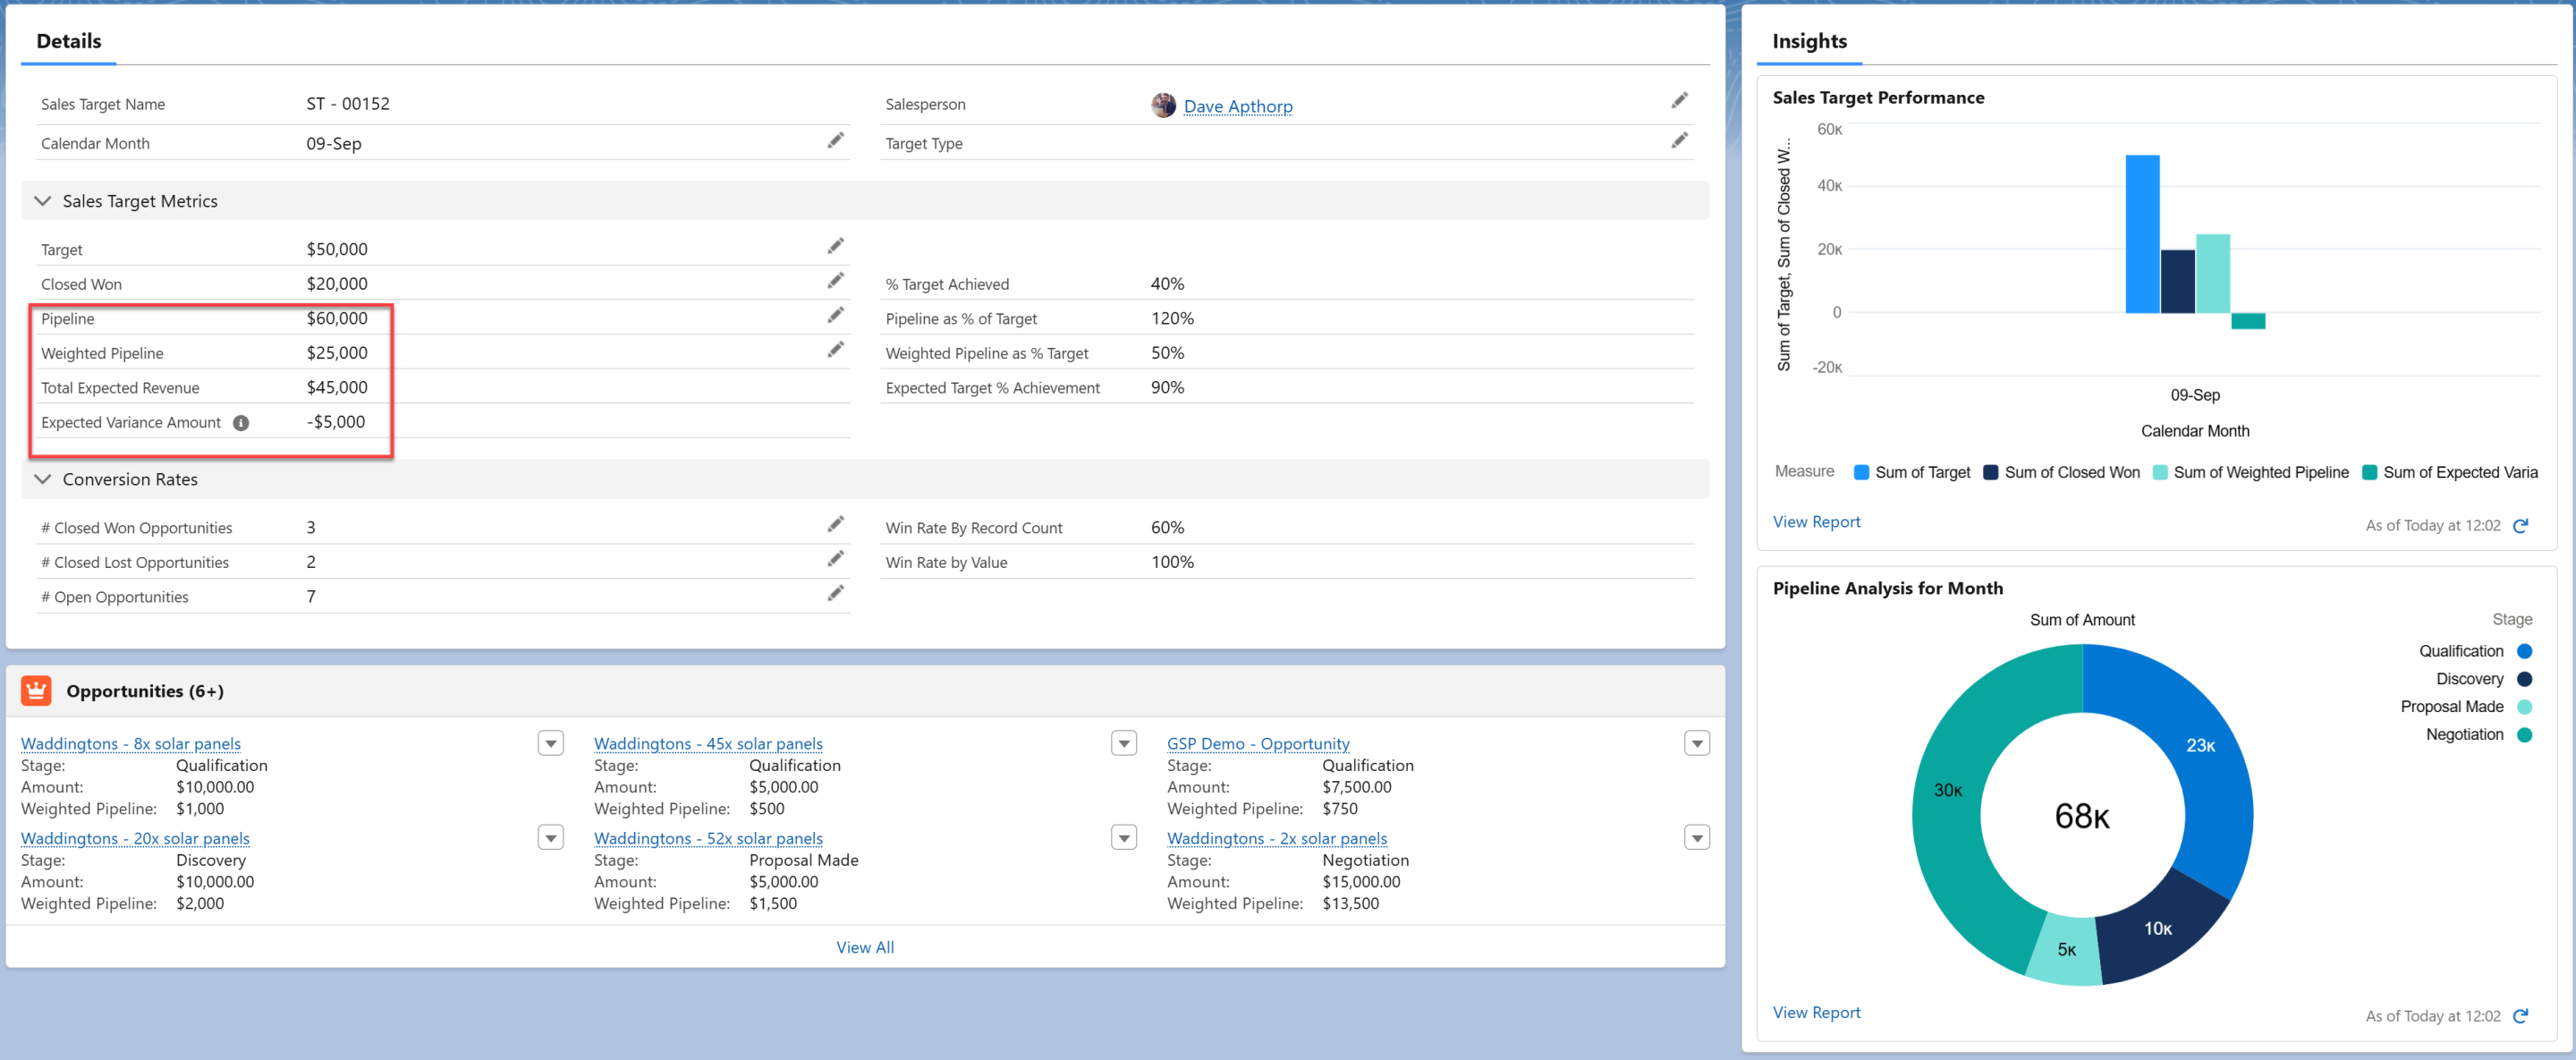
At first glance, it appears that Dave is on track to exceed his number – but the data tells a different story.
The weighted value of his pipeline is only $25,000. That means Dave’s expected revenue for the month is just $45,000 (the sum of won deals and the weighted pipeline).
In other words, Dave has a shortfall of $5,000 this month, and his remaining pipeline isn’t big enough to meet his quota.
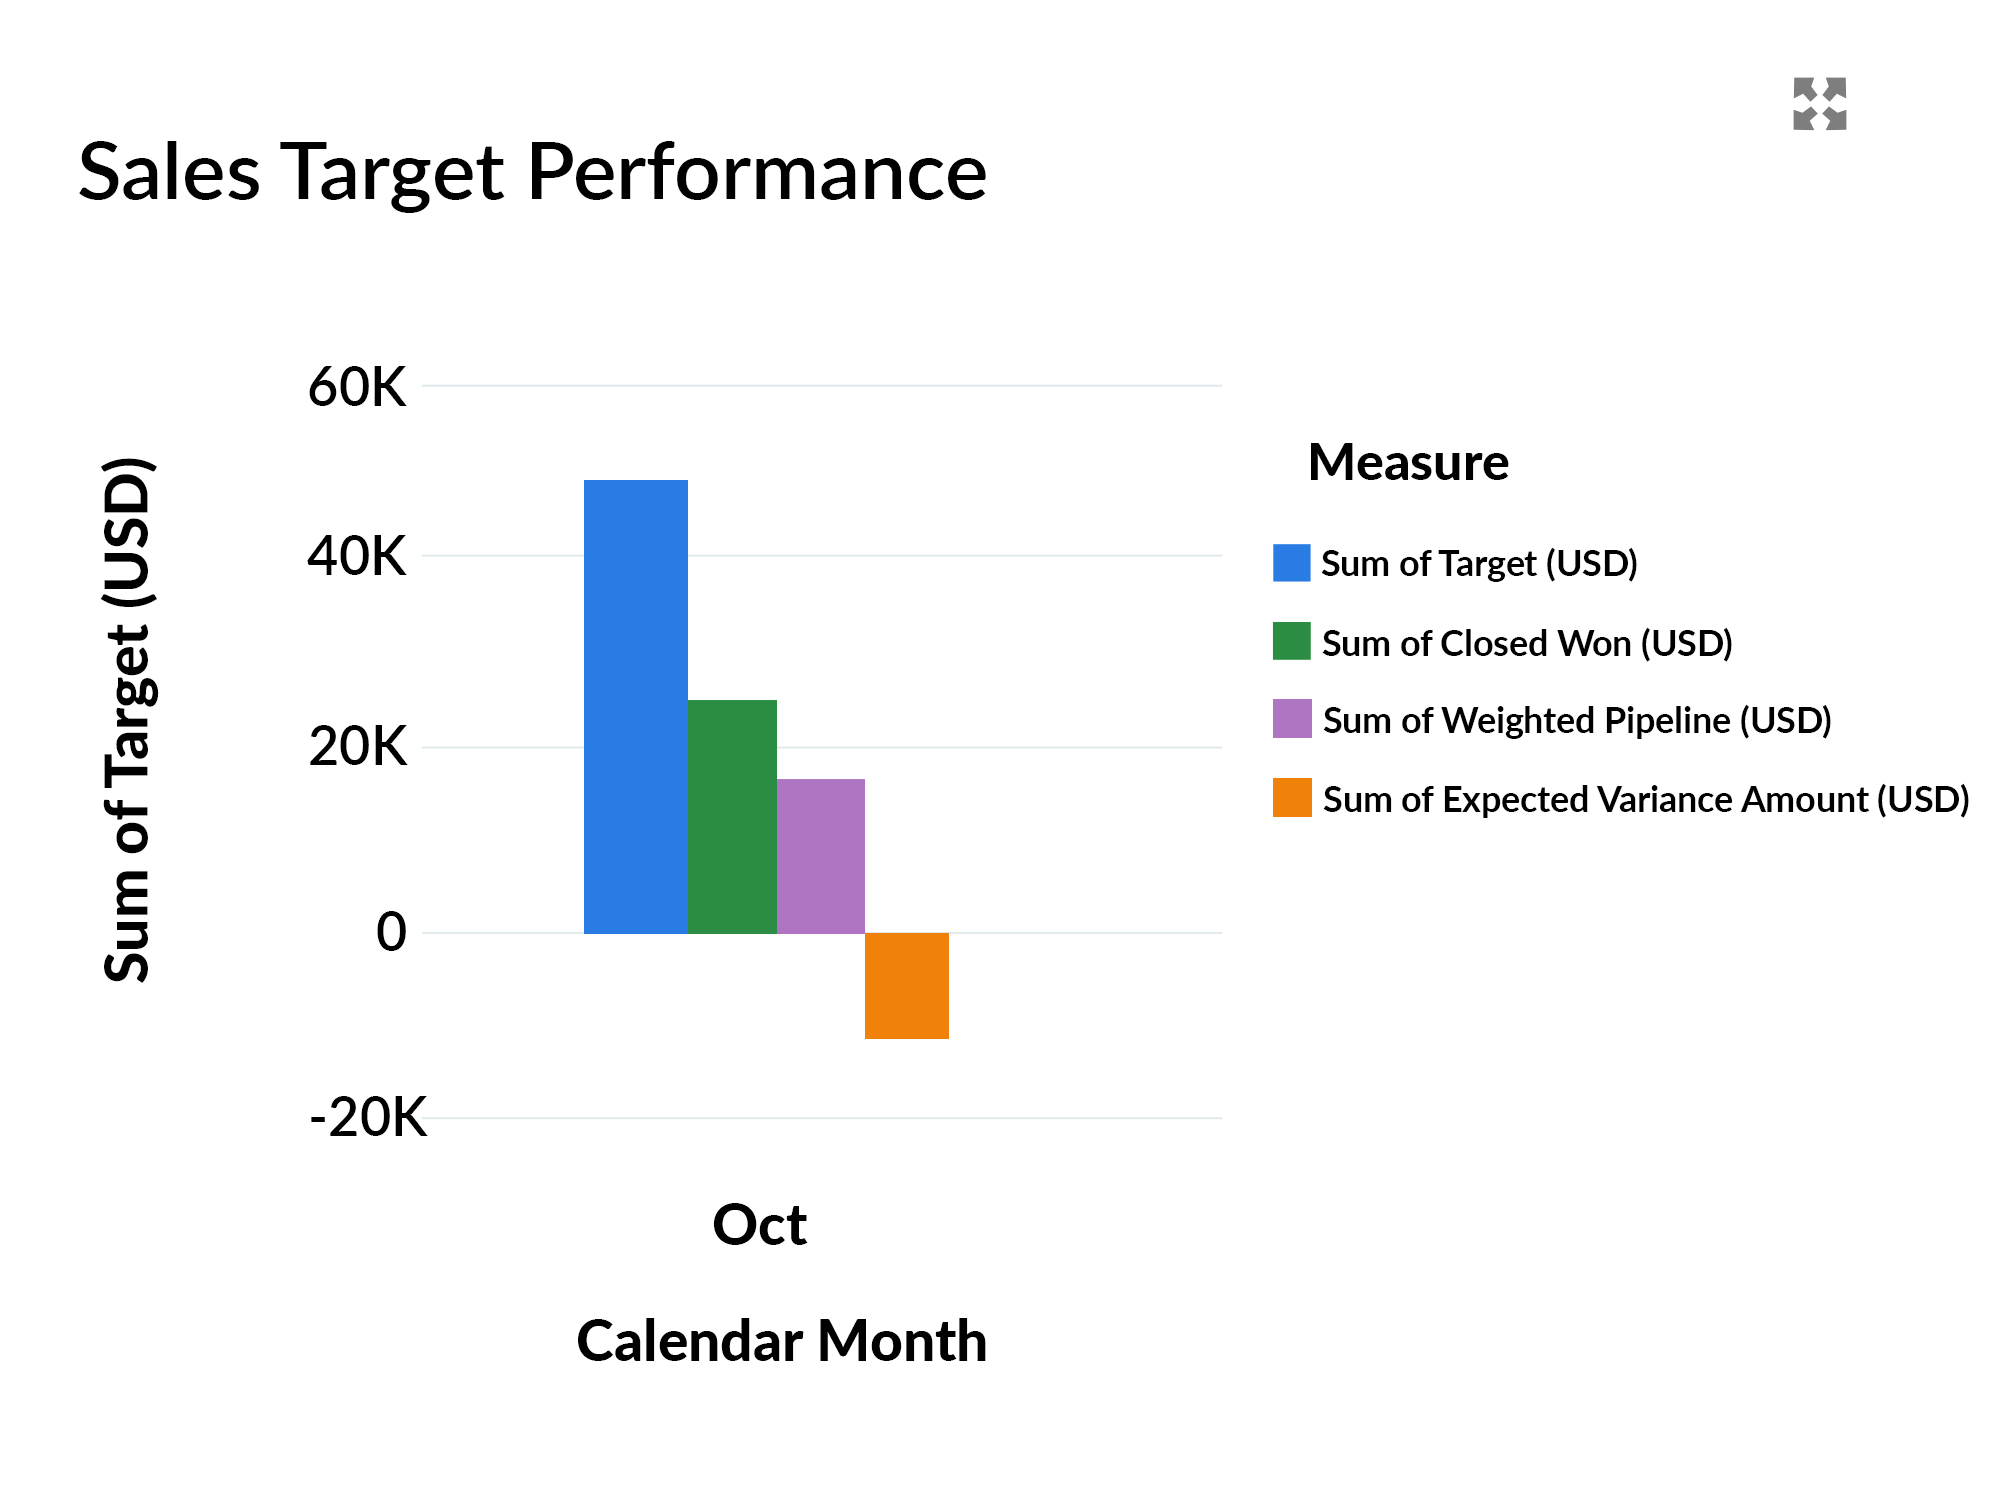
The above chart shows Dave's pipeline isn't big enough to meet his sales quota.
The blue bar represents Dave's target, the green column represents won deals, and the purple bar shows the weighted pipeline. The variance, which is negative in this case, is defined by the orange bar.
But the reporting data doesn't stop there. Look at the chart below.
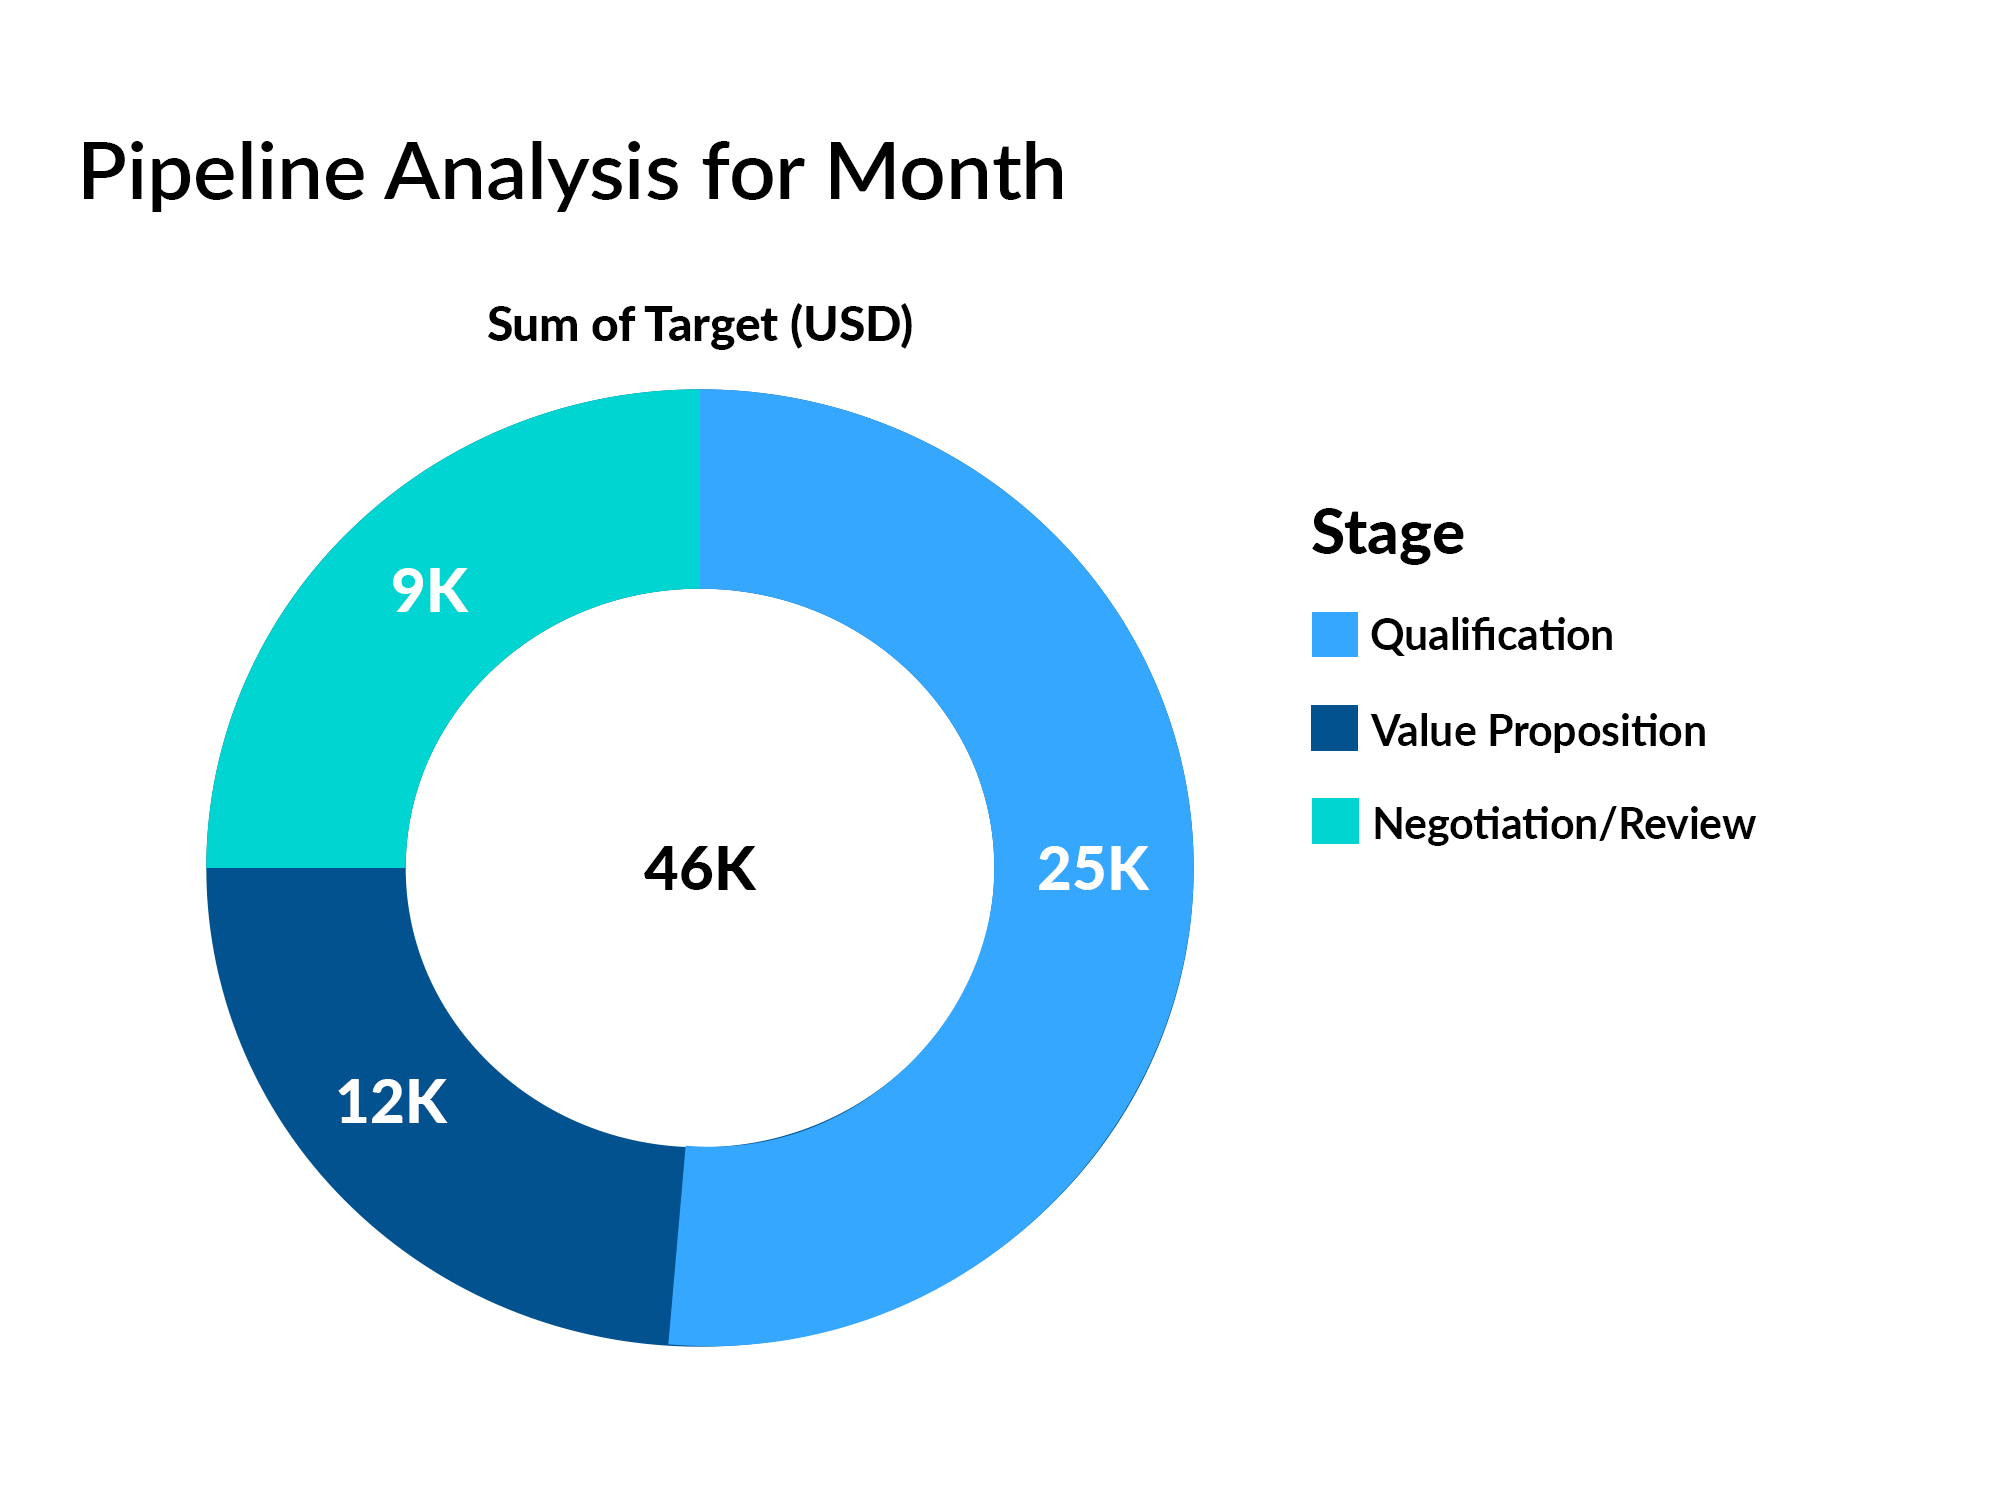
This chart shows the full value of Dave’s pipeline due to close this month, split by Stage.
Over 50% of the pipeline due to close this month is only in the qualifying stage, which makes me more concerned. It will be challenging for Dave to complete many of those deals if the average sales cycle is three or four months.
Further down the page, we see the opportunities that make up the pipeline.
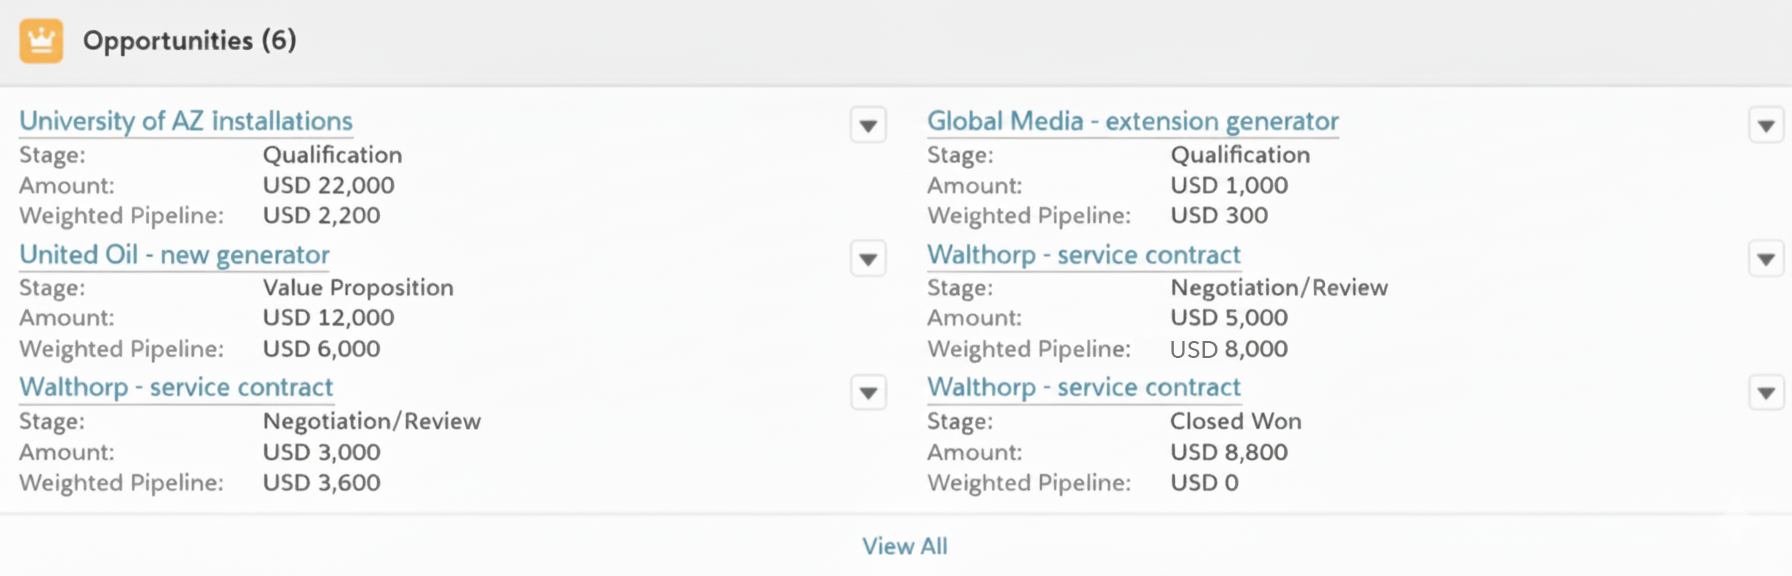
This view lets us focus on the deals that Dave needs to prioritize, and which early-stage opportunities should be pushed to later months.
Target Tracker Key Features
1. Sales Pipeline Coverage Dashboard
The GSP Target Tracker has a comprehensive dashboard that displays pipeline coverage for the company and all salespeople.
For example, this dashboard shows the performance of all salespeople in the current quarter.
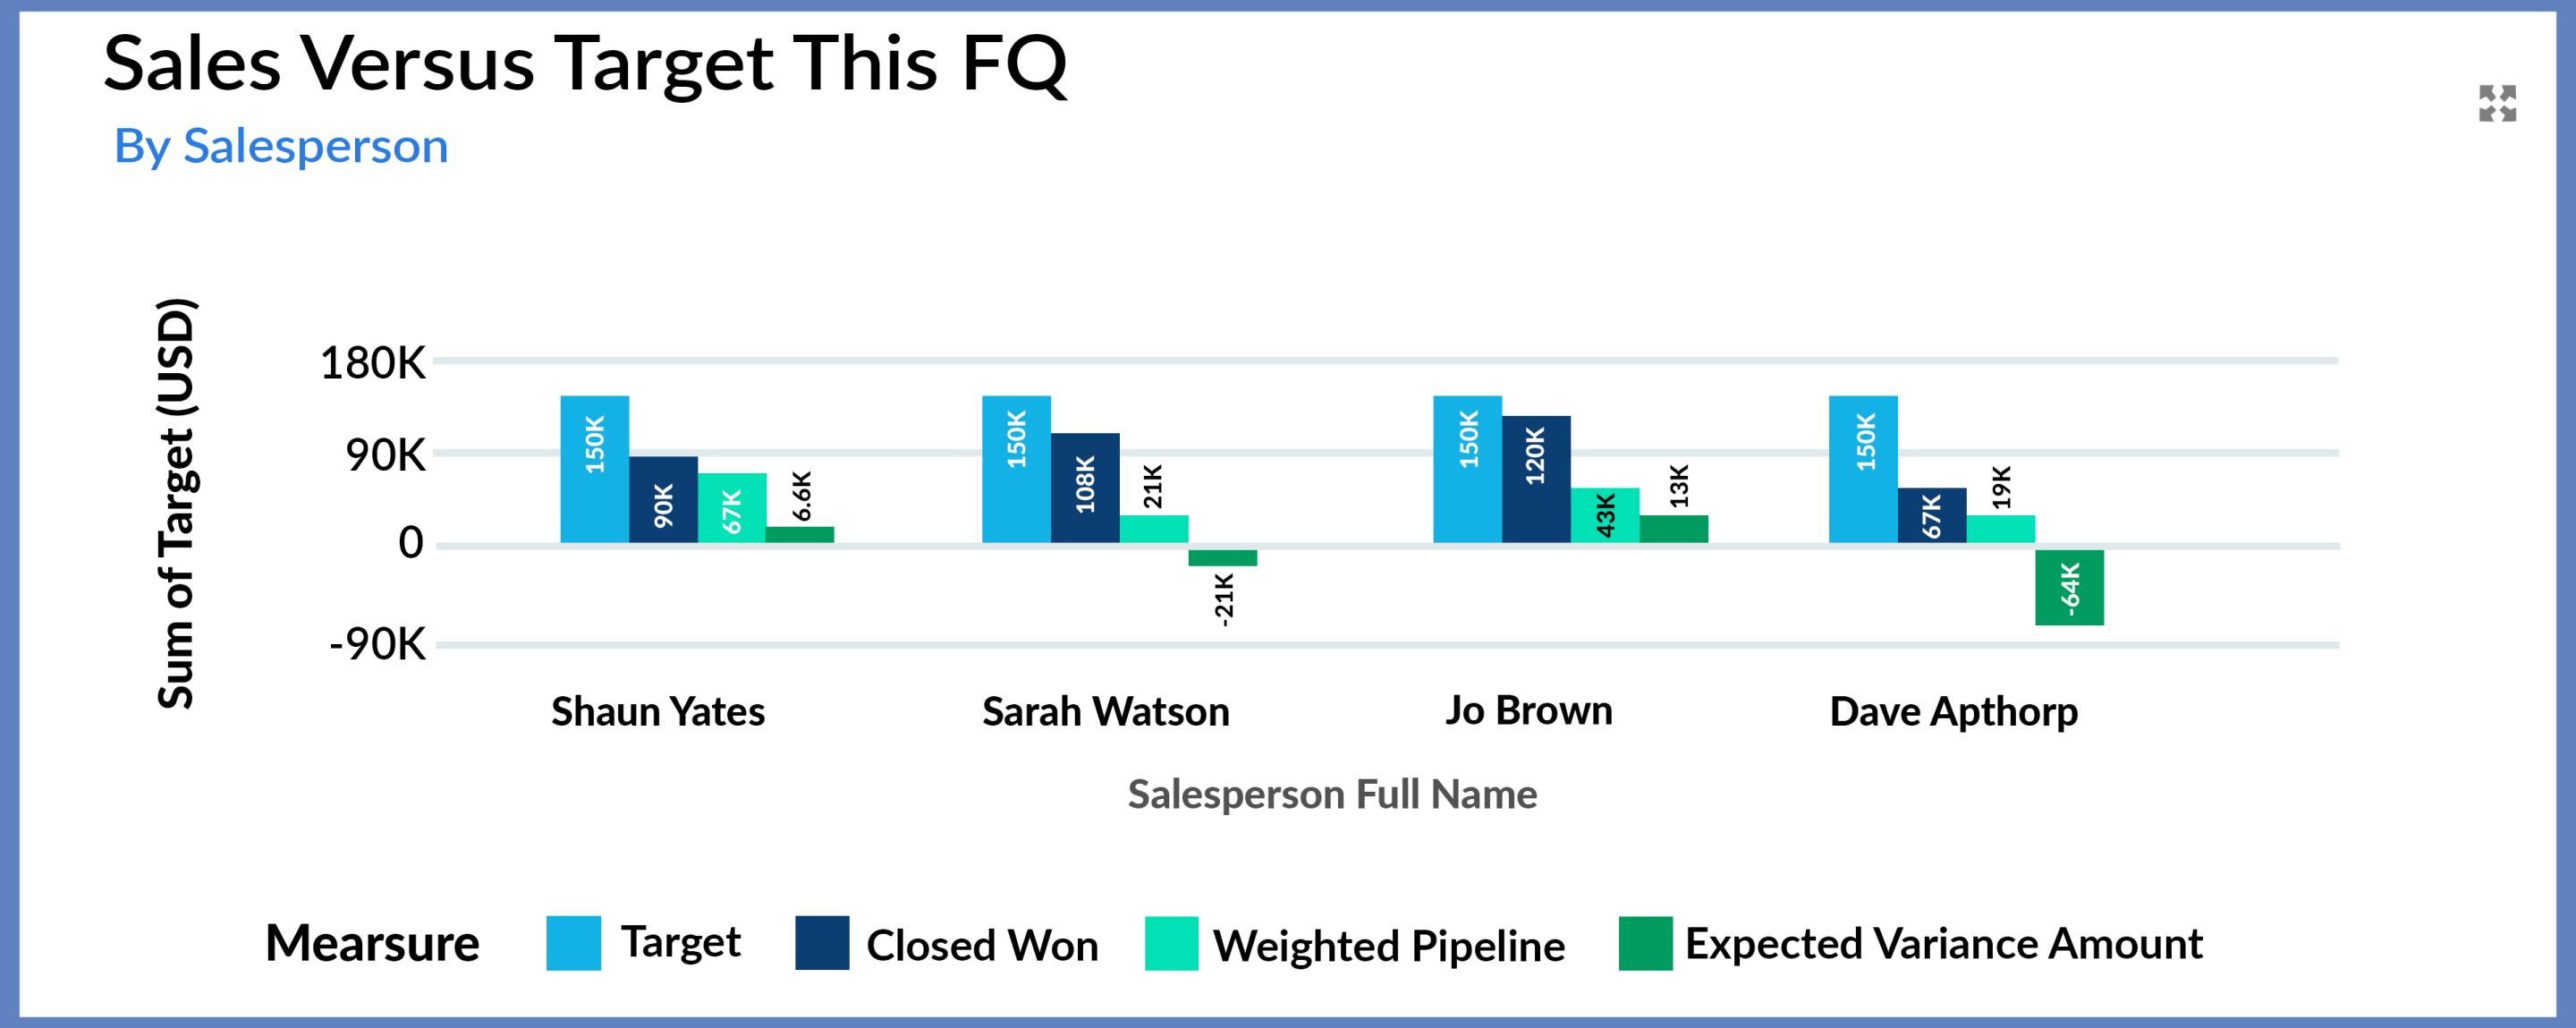
We can immediately identify who is likely to hit their target and who needs more support.
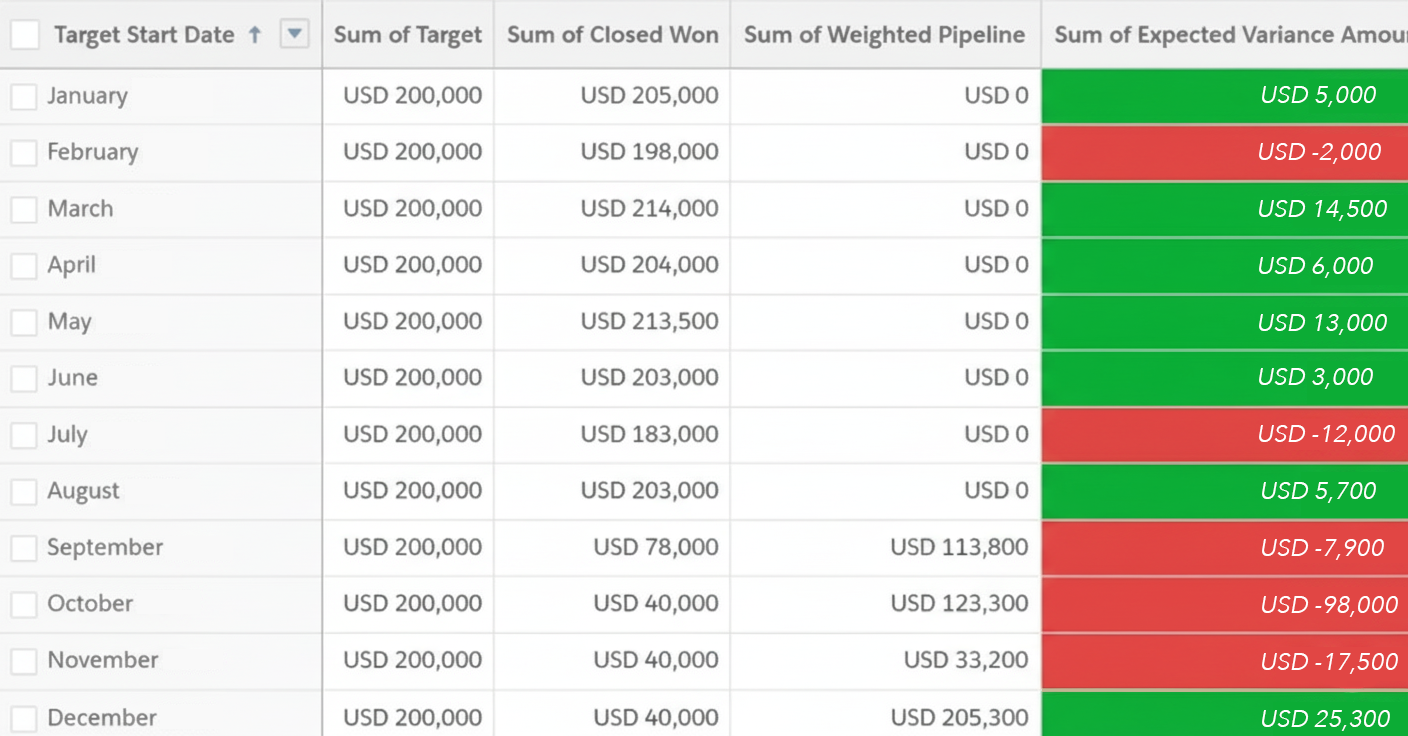
Another view displays the month-on-month pipeline coverage for upcoming months for the current fiscal year, and the historical performance for previous months:
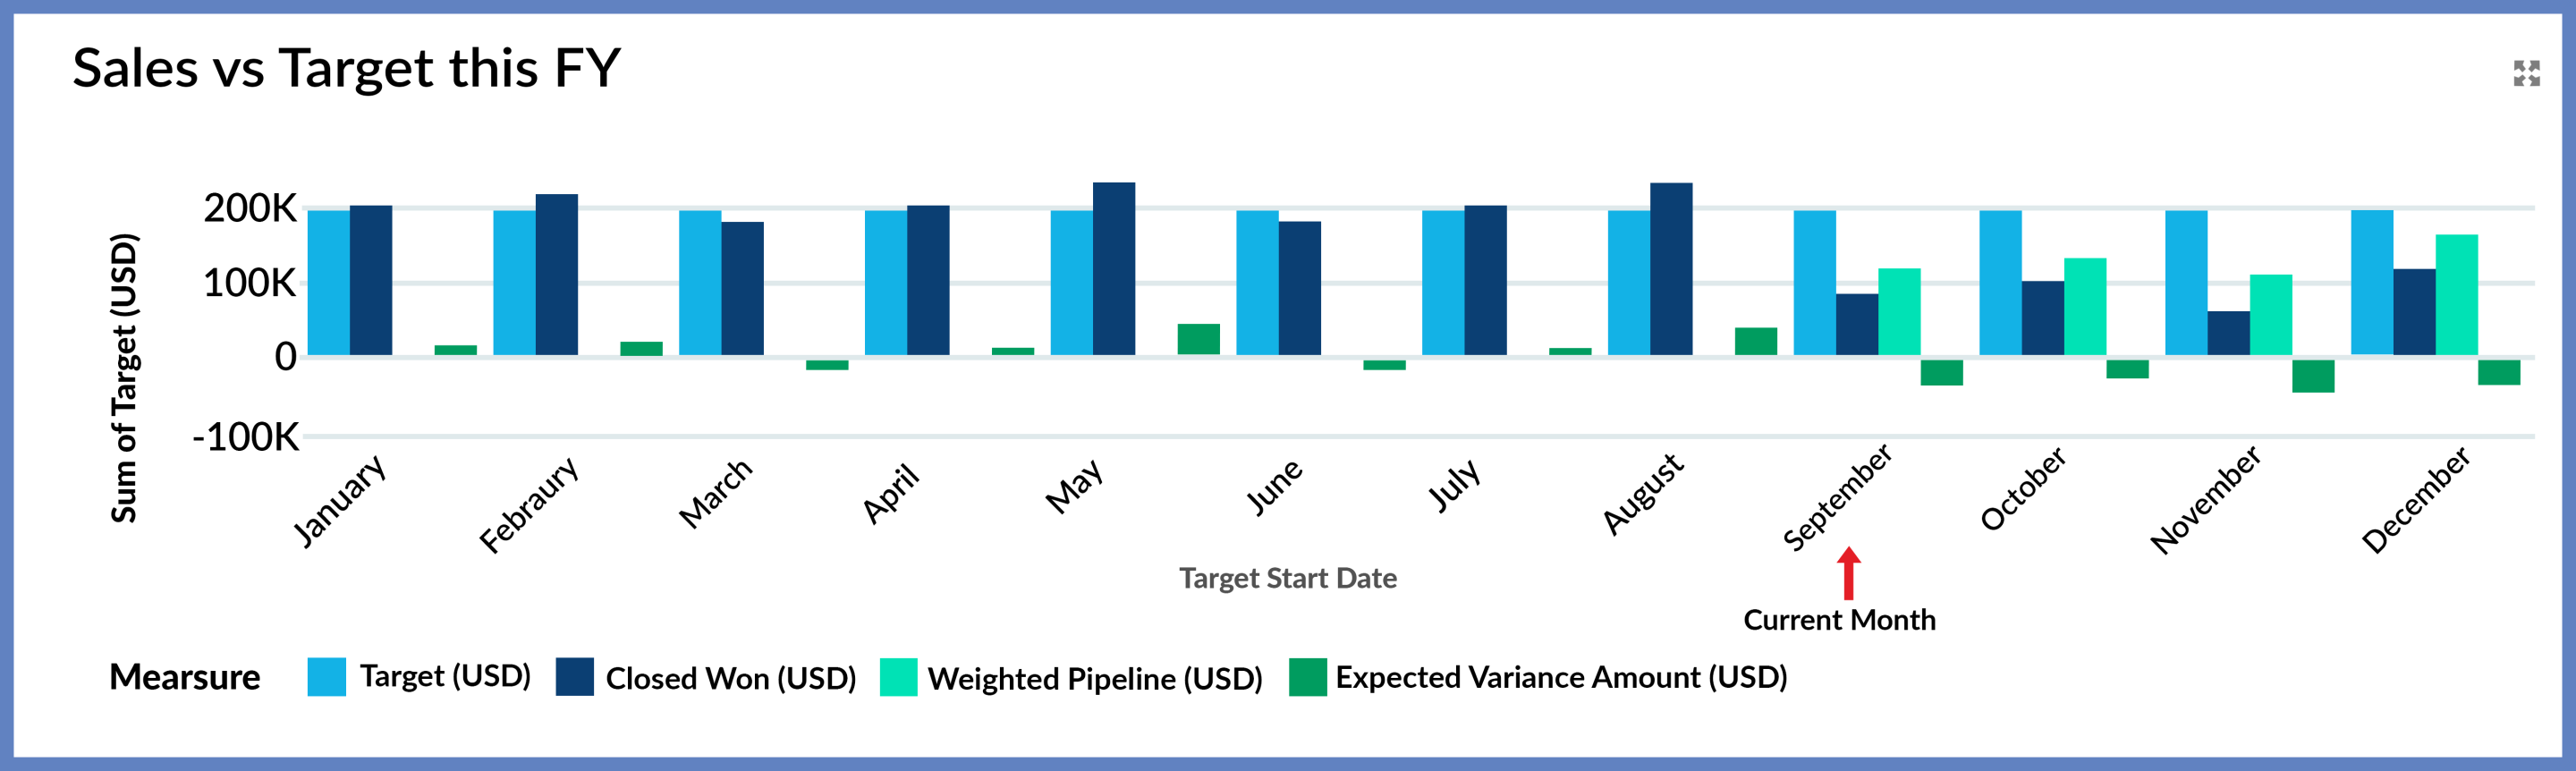
You can drill down into any report to see more information.
Pro-tip. Want to learn how to review pipeline coverage across your whole team? Read: Master Pipeline Coverage with the Sales Manager Dashboard
2. Measure Pipeline Coverage at team, region, and company levels
The Target Tracker includes out-of-the-box features that let you compare sales revenue and pipeline coverage at the team, regional, and company levels. For example, you can instantly roll all team targets up to the regional and company levels.
3. Fully Customizable to Your Needs
The Target Tracker is a powerful tool for measuring pipeline coverage based on the opportunity amount, and it can quickly adapt to use custom opportunity fields. You can also implement quarterly or annual targets instead of monthly targets.
This video demonstrates how it's straightforward to create targets for salespeople, teams, regions, and products:
Commonly Asked Questions
Yes – most sales teams should track pipeline coverage.
Proactively measuring pipeline coverage helps all sales teams that pursue opportunities at new and existing customers to achieve their targets. Pipeline coverage and funnel quality metrics allow these teams to evaluate whether they have enough deals of the appropriate quality to meet and surpass their quotas.
The only exception is for account management teams that depend on a series of transactional orders from customers to achieve their revenue targets. For these teams, key account plans aligned with the customers' business goals, along with a strong set of actionable business development objectives, will be the primary drivers of reaching revenue targets.
Over To You
Ready to measure pipeline coverage with confidence?
If you need guidance or would like to discuss how to confidently measure pipeline coverage for your business, contact us to arrange a call.
Or, to try the GSP Target Tracker for yourself. Take a free trial of the app today by visiting the AppExchange.
Still Flying Blind on Targets and Pipeline Coverage?
Book a free 45-minute demo. Tell us how you currently track targets and pipeline coverage — we'll show you exactly how Target Tracker fixes it, no strings attached.
Free Personalized Demo · 45-Minute Video Call · You Set the Agenda