Why An Expected Revenue Sales Forecasts Stands Up to Scrutiny | With Video & Examples
Your complete guide to accurate forecasting with expected revenue.
Last updated March 13, 2026


Download the 12 Must-Have Charts for Your Salesforce Dashboard eBook today!
At a Glance
Expected Revenue is one of the most valuable forecasting tools in Salesforce. However, it’s often misunderstood or underused. When used properly, expected revenue gives sales teams a clear view of their forecast by combining the value of won deals with the weighted value of open opportunities, producing a more reliable picture of how close you are to achieving your target.
This guide explains how to calculate expected revenue, improve your probability accuracy, and use these insights to strengthen your forecasting and pipeline coverage.
This article is a complete guide to using Expected Revenue in Salesforce.
Expected Revenue is a vital concept in sales because, when used correctly, it provides a reliable revenue forecast that can withstand scrutiny and a sales forecast you can defend in front of the board.
Expected Revenue also lets you know whether the funnel is big enough to hit your current sales quota.
Nevertheless, some people dismiss Expected Revenue as irrelevant.
That’s a pity. After all, inaccurate revenue forecasts and poor visibility of pipeline coverage versus target are the bane of many sales managers’ lives.
In this detailed guide, I explain:
- The correct way to calculate Expected Revenue.
- How Expected Revenue is different from the Weighted Pipeline.
- Why you should use this powerful tool for sales forecasts.
- The critical role of opportunity probability (and how to make the percentages more accurate).
- How to use Expected Revenue for target tracking and measuring pipeline coverage.
With that, let’s start.
How to Calculate Expected Revenue
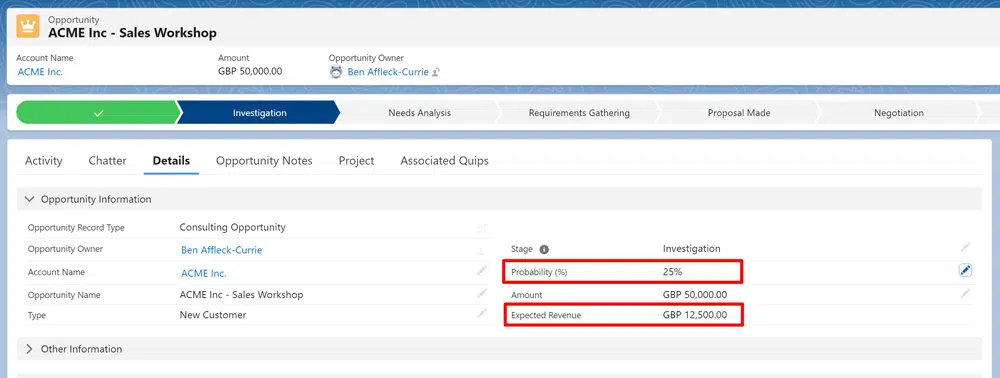
You calculate the Expected Revenue of an opportunity by multiplying the deal’s value by the probability of a successful outcome. Of course, if the opportunity is already won, you use 100% as the probability.
This calculation gives you a dollar value for each opportunity. Sum these numbers to get the total Expected Revenue for all deals slated to close in a period.
For example, let’s say you have an opportunity with a close date in June. If the deal is worth $50,000 and the probability is 25%, the Expected Revenue is $12,500.
Increase the probability to 30%, and your Expected Revenue is $15,000.

Adding up these dollars for all your deals closing in June gives you the total Expected Revenue for that month.

Naturally, you can sum the Expected Revenue for each month, quarter or year.
The Difference Between Expected Revenue and Weighted Pipeline
You might be thinking:
The Expected Revenue formula sounds like the math for the Weighted Pipeline. What’s the difference?
It’s this:
The Weighted Pipeline refers only to open deals. In other words, you only have opportunities in the funnel in your Weighted Pipeline report.
In contrast, Expected Revenue includes your pipeline deals AND opportunities you have won.

The probability of winning a deal already in the bag is 100%. Consequently, your Expected Revenue report includes these deals at their total value, plus the weighted amount for each pipeline opportunity.
Let’s take our earlier example.
We have a pipeline opportunity in June with an Expected Revenue of $12,500.
However, let’s say we already signed a deal for $15,000 that month. That means our total Expected Revenue for June is $27,500.
Calculating Expected Revenue in Salesforce
Fortunately, you don’t need to open Excel or reach for pen and paper to calculate the Expected Revenue in Salesforce and most other CRM tools.
The system does it for you.
In Salesforce, the field on the opportunity is, you guessed it, Expected Revenue.
Nevertheless, there’s an odd quirk in Salesforce. When you get started, Salesforce hides the field from all users.
Make the field visible by updating the field-level security and field visibility.
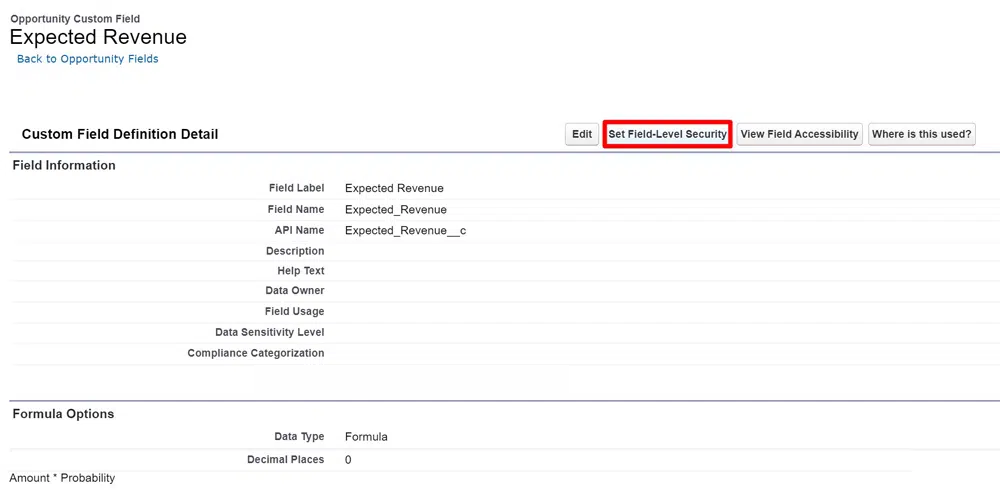
This step will also make the field available for reports and charts.
Why You Should Use Expected Revenue in Sales Forecasts
Some executives dismiss Expected Revenue.
“Opportunities are binary”, they say. “You either win the deal, or you don’t.”
For example, let’s say you have a pipeline opportunity for $10,000. If you win the deal, it’s worth $10,000. On the other hand, it’s worth zero if you lose it.
However, these managers believe Expected Revenue is irrelevant because it doesn’t reflect this binary outcome. In other words, they don’t like that the Expected Revenue report shows a figure for this opportunity between $1 and $10,000, depending on the probability.
Instead, they say, the report should show $0 or $10,000 based on whether you are forecasting a win.
But wait a moment. Here’s why using Expected Revenue in sales forecasts makes sense.
Let’s say your team has 50 deals due to close this quarter.
You know you will win some and lose some.
But here’s the problem:
You can’t be sure which you will win and which you will lose. As we all know, it’s pretty darn tricky to predict the outcome of sales opportunities confidently.
Of course, if you knew in advance which deals you would win, your sales forecast would include them at 100% of their value. And you wouldn’t bother chasing deals you know will be lost.
However, life isn’t like that, unfortunately. No matter how good your qualification process is, we all know it’s hard to predict the outcome of a sales deal.
Nevertheless, despite the uncertainty, we are still under pressure to produce reliable sales forecasts.
That’s why Expected Revenue is a powerful tool. Taking the weighted value of each deal, plus the full value of won opportunities, reflects the uncertainty sales executives face and produces a forecast we can explain and justify. It reflects the probability of winning each deal rather than taking each opportunity at 100% or zero percent.
Next up, let’s talk about opportunity probability.
The Role of Opportunity Probability in Expected Revenue
A reliable expected revenue report depends on realistic probabilities for each pipeline opportunity. So, what can you do to improve probability accuracy?
(We don't need to worry about won deals; we can take their value at 100%).
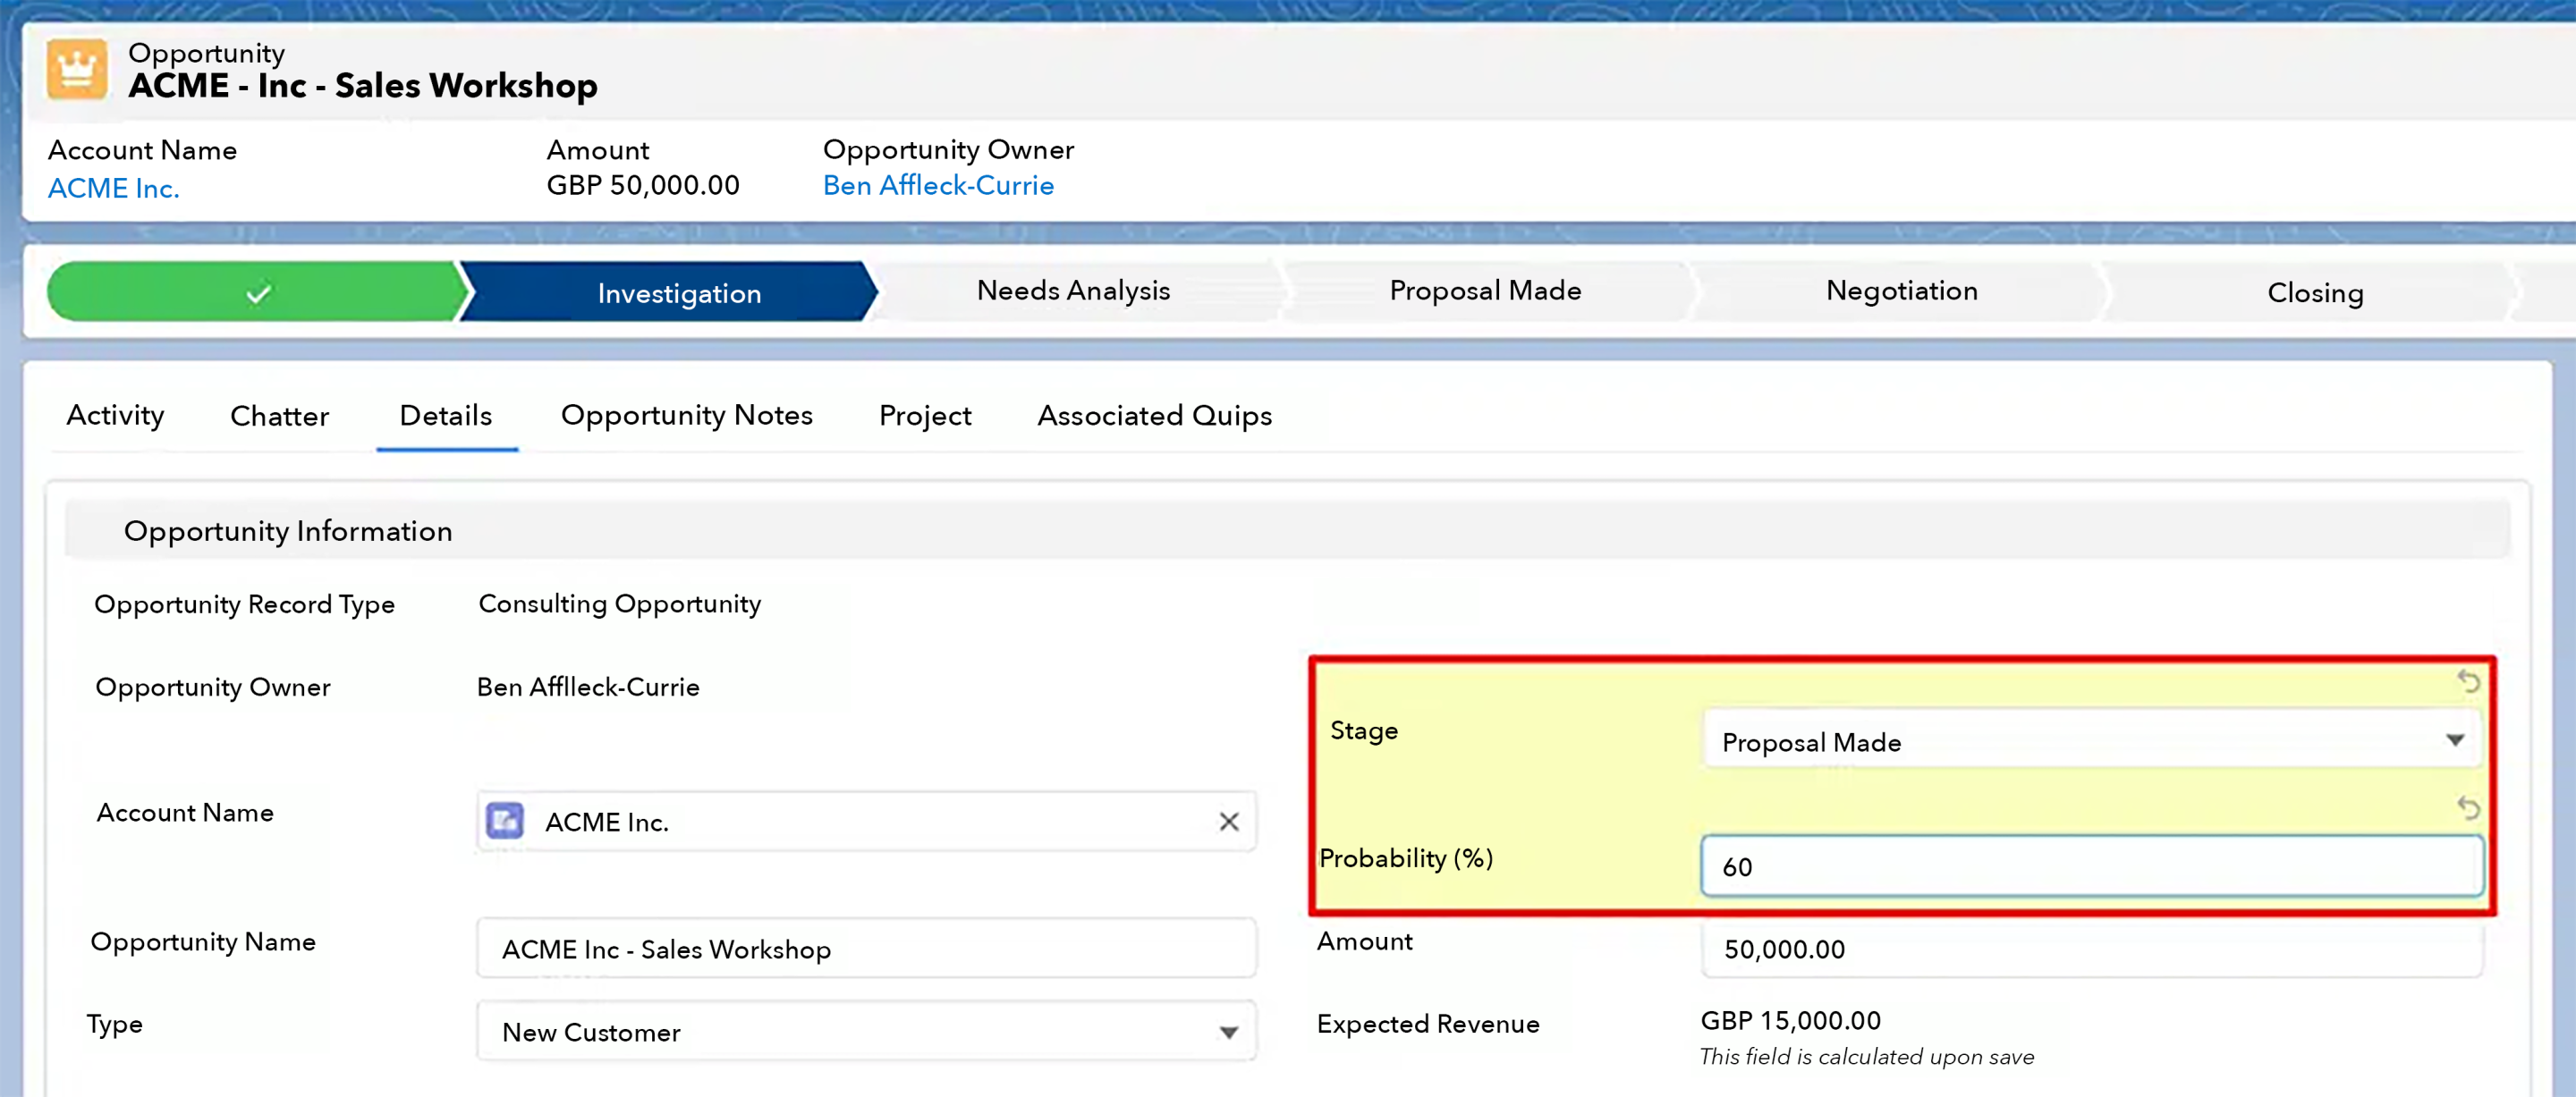
Like most other CRM systems, Salesforce's opportunity probability relates directly and only to the Opportunity Stage.
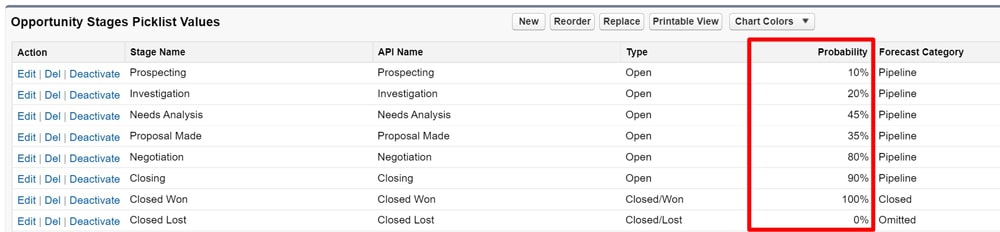
In other words, the probability automatically increases if the Stage moves forward. That happens even if your chance of winning the deal hasn't changed.
What does this mean? You can significantly improve the reliability of your Expected Revenue reports by manually adjusting the probability.
Manually Adjust the Opportunity Probability
Most salespeople believe there's a fixed probability for each Stage.
However, that's not the case. You can change the percentage on each deal, and you only need to type the new value into the box.
When should you do this? For example, let's say you are working with a long-time, regular customer. Usually, the chance of winning the deal is higher compared to selling the same products and services to a new prospect.
Pro-tip: Fine-tune the probability of each opportunity based on real-world factors and the salesperson's intimate knowledge of the deal.
I recommend you assess the percentages on each deal in your pipeline reviews. Focus on the more significant opportunities, and check that the probability reflects your judgment on the chances of winning the contract.
This simple step can significantly impact the reliability of Expected Revenue reports.
Using Expected Revenue for Target Tracking and Pipeline Coverage
When measuring sales versus quota, you need to know two vital things.
First, did we hit our target in previous months and quarters? And second, do we have sufficient pipeline coverage (in other words, enough deals of the right quality) to achieve upcoming targets?
The answer to the first question is relatively straightforward. We either achieved our quota or we didn’t.
However, the second question, the one about pipeline coverage, exercises sales leaders every day.
Whether we will achieve the target in the current period depends on how much business we have won and the weighted pipeline.
And guess what? That’s the formula for Expected Revenue.
Similarly, for future targets (next month, next quarter), Expected Revenue tells us whether we have sufficient pipeline coverage because it measures the weighted funnel. (It excludes won deals for future targets because we can’t have a won deal in the coming months.)
And that’s precisely how the GSP Target Tracker works. Let’s take an example.
How the GSP Target Tracker Uses Expected Revenue
Here’s the target for Dave Apthorp for the current month.
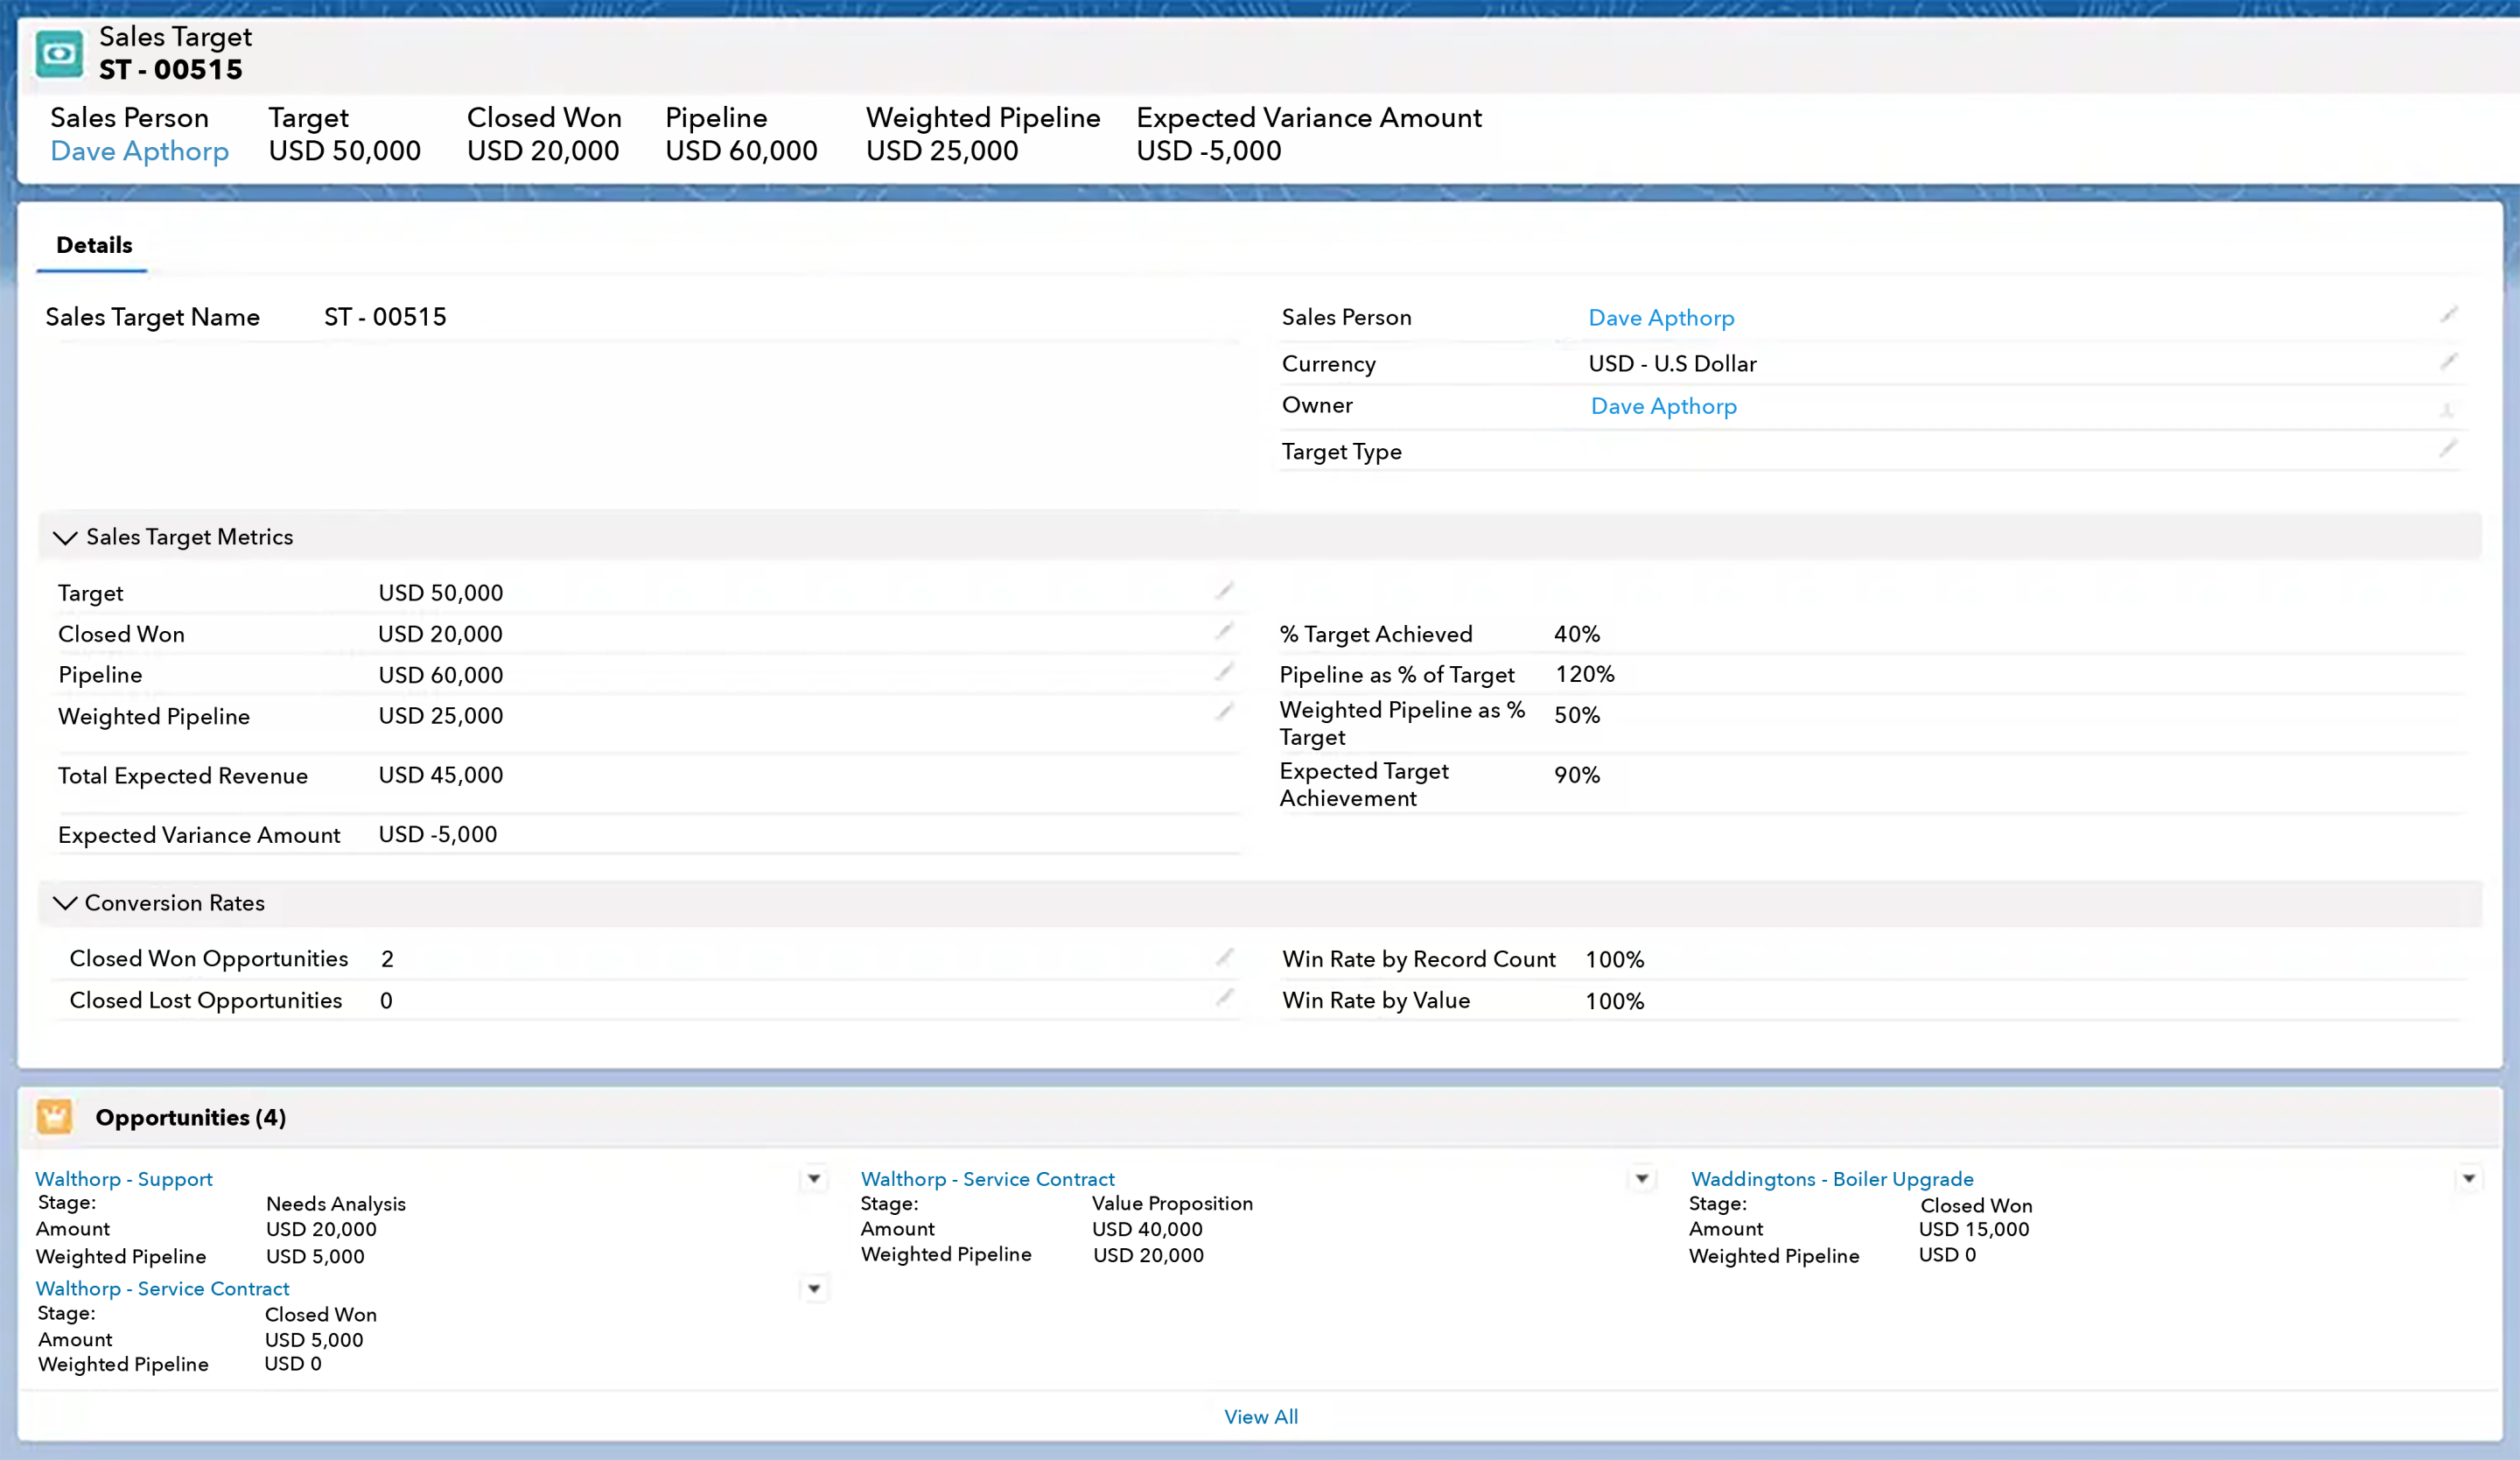
You can see that Dave’s target is $50,000 and that so far this month, he’s won $20,000. That’s a good start.
But will Dave hit his number?
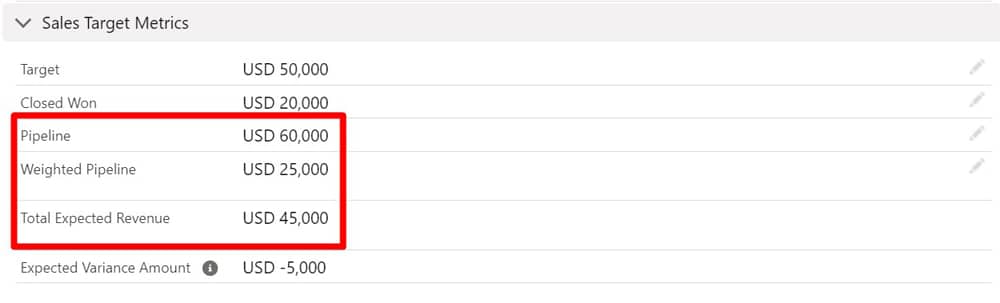
His total pipeline for this month is $60,000.
That sounds great on the surface. However, the weighted value of that pipeline is only $25,000.
That means Dave’s expected revenue is $45,000 (20,000 won, plus $25,000 for the weighted pipeline).
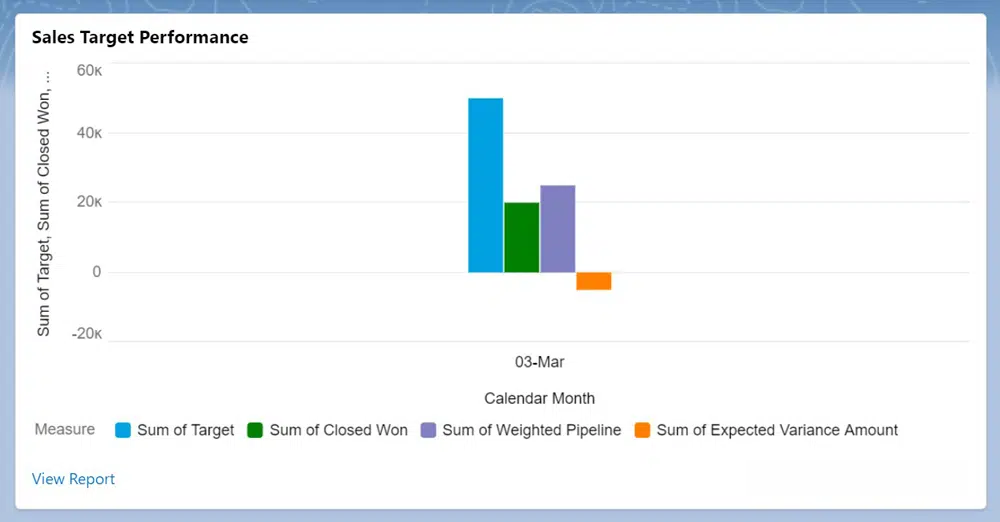
Therefore, we are forecasting a $5,000 shortfall for Dave this month. The chart on the right displays this information.

In other words, the Target Tracker uses Expected Revenue to provide visibility on whether reps, teams, regions, and the company will achieve quota.
Watch the video below and explore other videos in our Target Tracker YouTube playlist to learn more about the app:
Contact us for a walk-through of the Target Tracker, or visit the app's dedicated page to learn more.
Commonly Asked Questions
Recommended Resources
Here are three resources with more information on using expected revenue for sales forecasts, pipeline reviews, and target tracking:
- Test Drive the Target Tracker in a pre-configured Salesforce environment.
- Learn more about comparing sales performance and pipeline coverage to quota: The Best Way To Track Sales vs Targets in Salesforce.
- Explore why sales forecasts are often wrong and learn what you can do about it, including making better use of expected revenue: How To Create Reliable Sales Forecasts Using Salesforce.