How To Create Reliable Sales Forecasts in Salesforce with Zero Effort
Why Your Salesforce Forecasts Miss the Mark—and How to Get Your Sales Forecast Reports Right (Includes a Sales Forecast Template)
Last updated June 10, 2026


Download the 12 Must-Have Charts for Your Salesforce Dashboard eBook today!
If you struggle to create reliable sales forecasts, you’re not alone. According to the State of Sales Report, only a third of professionals trust the accuracy of the data in their sales forecast reports.
As a result, many executives feel embarrassed when their sales forecasts fluctuate wildly at the end of the month. Meanwhile, your executive team may wonder why their investment in Salesforce licenses—intended to bring clarity to the pipeline and confidence in sales forecasting—isn’t delivering the expected results.
So, what’s the answer?
Relying on gut instinct won’t cut it. And simply applying a blanket, top-down win rate to every opportunity won’t help either.
Sales forecasts are regularly shared with company leadership to support strategic planning. In addition, colleagues in finance, fulfilment, manufacturing, and other critical departments depend on your revenue projections to do their jobs effectively. What you need, therefore, is a robust sales forecast that stands up to scrutiny (even though it doesn’t need to be perfect).
In many organizations, sales forecasts can be far more reliable than they are today. In this article, we’ll show you how to fix yours—simply and cost-effectively.
How To Create Reliable Sales Forecasts in Salesforce
What is a Sales Forecast?
A sales forecast predicts your sales team’s revenue over a defined period—such as the current month or quarter. It includes revenue from deals already won, plus an estimate of the value of opportunities in the pipeline that are expected to close successfully within the remaining time.
Reliable sales forecasts are critical to successful businesses because they:
- Provide executives with early insight into the company’s health
- Help sales managers understand whether current wins and pipeline are sufficient to hit quota
- Enable fulfilment, order processing, manufacturing, and other teams to plan effectively
- Support accurate updates to the Board and external investors
- Allow finance teams to forecast cash flow with confidence
Often, the second point is the most important. Without an accurate view of sales versus target in Salesforce, you can’t reliably predict whether you’ll finish over or under target at the end of the month or quarter. This, in turn, affects how you manage your team and resources.
For example, if you’re confident that the combination of won deals and likely pipeline exceeds your target, you can focus on closing existing opportunities. If your forecast falls short, you know you need to generate more pipeline.
An unreliable sales forecast undermines sales effectiveness. It’s also why many organizations resort to unnecessary end-of-month discounting—simply to force deals over the line.
Why are Sales Forecasts in Salesforce Unreliable?
There are three common, addressable reasons why Salesforce sales forecasts miss the mark:
- Deals slip out of the forecast at the last minute
- Deals appear seemingly out of nowhere at the last minute
- The pipeline and forecast include deals that no longer have legs
Let’s explore each in more detail.
1. Deals Slip from the Sales Forecast at the Last Minute
This is the most common cause of unreliable Salesforce forecasts. Opportunities that were confidently expected to close during the month or quarter suddenly slip—often at the last moment.
Worse still, the same deals often slip repeatedly, month after month. This happens for several reasons:
- Salespeople are natural optimists, and deals often take longer than expected
- Pressure to maintain pipeline size discourages reps from marking deals as Lost
- Poor qualification allows weak deals to linger in the pipeline, then slip from the forecast
2. Deals Appear Out of Nowhere at the Last Minute
Most sales managers have worked with the “hero” salesperson. Just when it looks like the team will miss the number, they swoop in at month-end with one or two deals. Sometimes this saves the forecast—but it also raises an awkward question:
“Why wasn’t this deal in the forecast you submitted earlier?”
This behaviour is known as sandbagging.
It doesn’t only apply to large deals. Salespeople may keep opportunities hidden to:
- Avoid scrutiny
- Reduce management pressure to close early
- Create a dramatic month-end win
While it’s tempting to blame salespeople, the root cause is often managerial behaviour. Either way, deals that aren’t in Salesforce aren’t included in the forecast—and that undermines accuracy.
3. The Pipeline Contains Deals That No Longer Have Legs
Does your pipeline include deals that—realistically—are never going to close successfully?
This happens when:
- Salespeople are reluctant to abandon opportunities they’ve invested heavily in
- Reps avoid the scrutiny or embarrassment of marking deals as Lost
- Customers quietly disengage without formally saying no
In these situations, pipelines are often described as waterlogged—you’re wading knee-deep in deals, searching for solid ground.

With that, let's dive in.
How Do You Create Sales Forecast Reports in Salesforce?
The Expected Revenue Report is the most effective way to create a sales forecast in Salesforce. It combines:
- 100% of revenue from Won deals
- A weighted value of pipeline opportunities
You can optionally filter out early-stage deals or opportunities that have slipped multiple times.
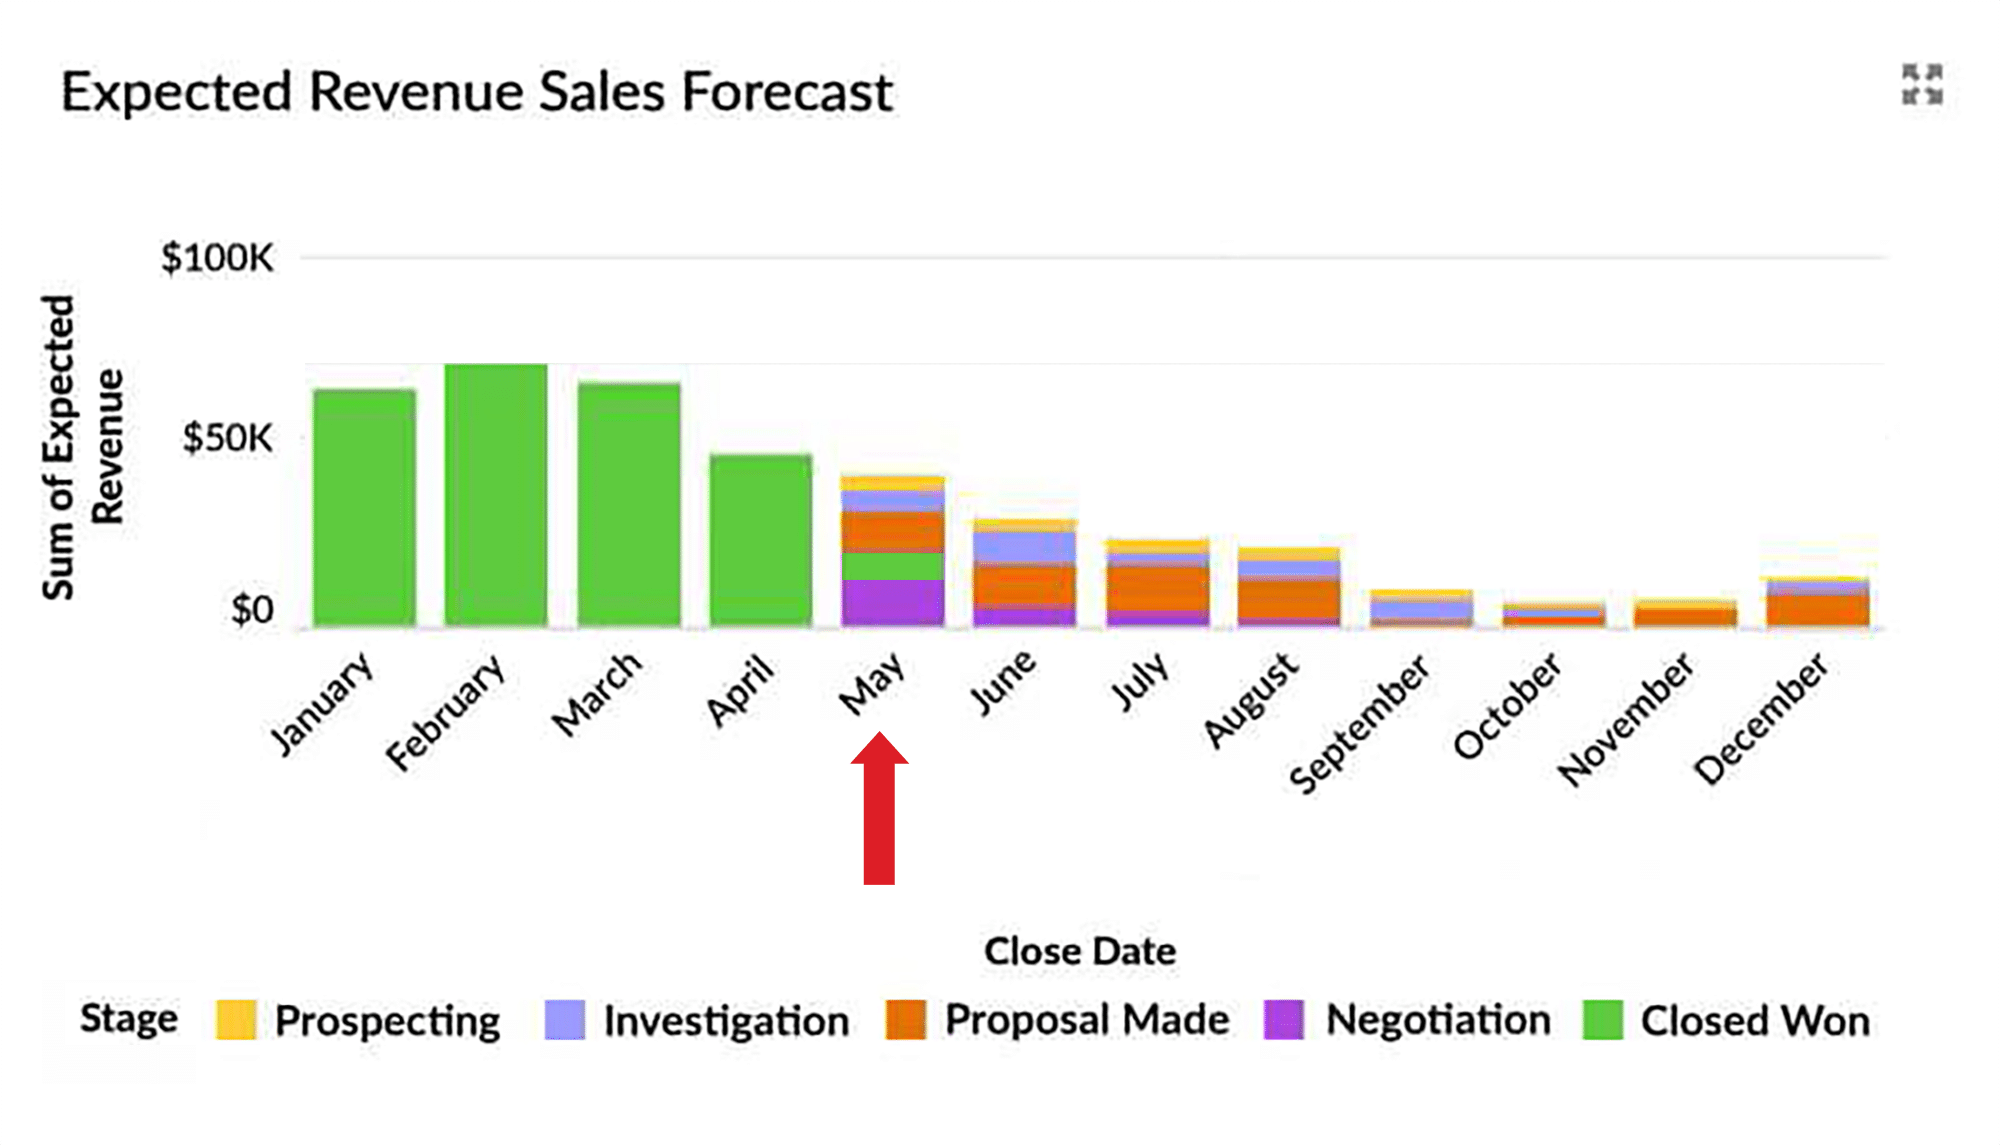
- A $10,000 deal at 40% probability contributes $4,000
- A $20,000 Won deal contributes $20,000
Is it Right to Use the Expected Revenue of Pipeline Opportunities?
Some sales leaders argue that deals are binary—you either win them or you don’t—so forecasts should include 100% or 0%. However, you can’t know for sure in advance which deals will close in each period.
Experienced sales managers are critical in helping their team qualify opportunities robustly, thereby minimizing time on deals the salesperson is unlikely to win. However, you still cannot always be sure which deals you'll lose (or you’d tell your team not to bother with them in the first place!). Therefore, taking the weighted value of pipeline opportunities gives a reliable total sales forecast.
Even with strong deal qualification, uncertainty remains. That’s why using weighted pipeline values produces a more reliable aggregate forecast.
How to Get Reliable Opportunity Probabilities for Sales Forecasting in Salesforce
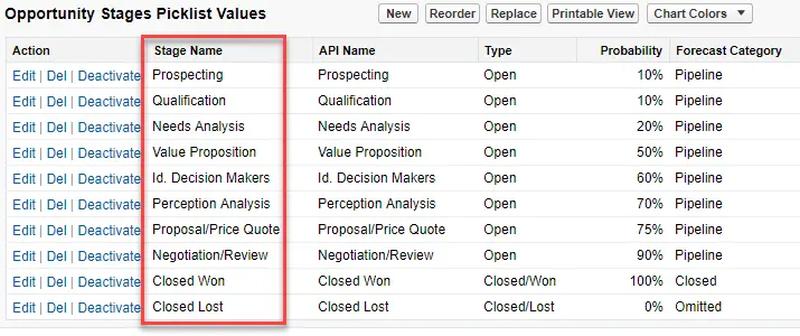
Salesforce assigns default probabilities to each opportunity stage (which admins can adjust). When a rep changes the stage, Salesforce automatically updates the probability.

What many people don’t realize is that salespeople can override these probabilities manually.
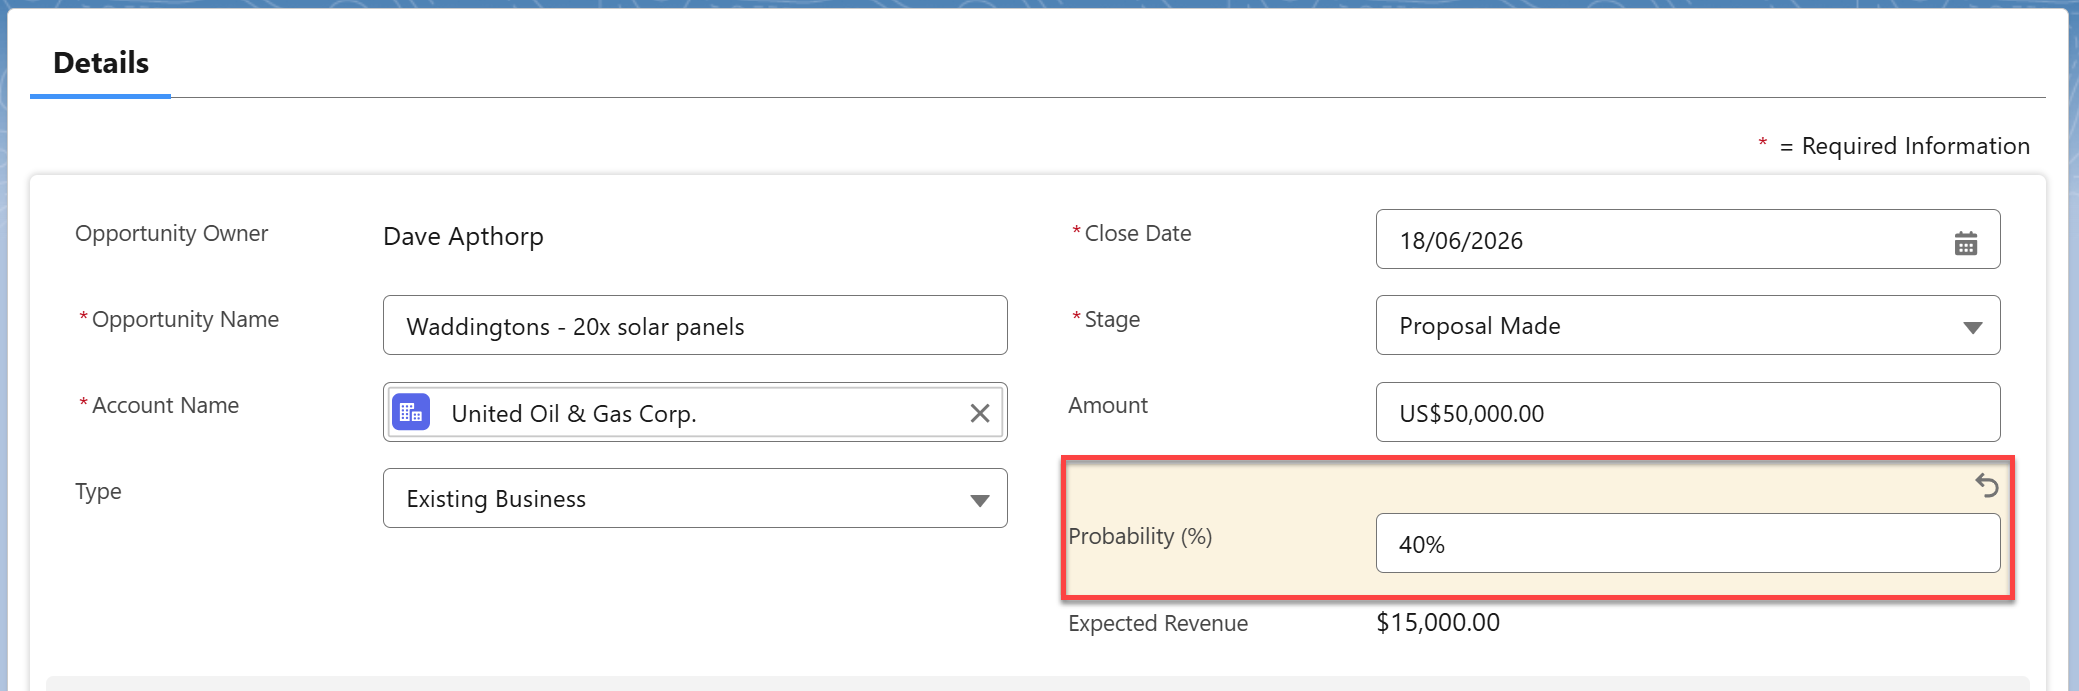
This is useful when:
- A new customer deal deserves a lower probability
- A long-term existing customer warrants a higher one
This flexibility improves forecast accuracy—when used responsibly.
How to Get the Expected Revenue Sales Forecast Report
Yes—there is an easy way.
Simply install the GSP Sales Dashboard, a free AppExchange package that includes all the reports and metrics referenced in this guide.
Is Your Salesforce Working as Hard as You Are?
Book a free 45-minute review. Bring your biggest challenge — we'll give you straight-talking, actionable advice, no strings attached.
Free Salesforce Review | 45 Minute Web Meeting | You Set the Agenda
How To Improve Your Sales Forecasting Accuracy
Here are seven best practices you can apply immediately:
- Take a balanced approach to management pressure.
- Establish a pipeline review cadence.
- Align opportunity stages and probabilities with your sales process.
- Qualify deals throughout the sales cycle using clear exit criteria.
- Use pipeline quality metrics to identify risky deals.
- Sense-check forecasts using win-rate and conversion metrics.
- Agree on close plans with customers—avoid “commit” forecasting.
Let’s explore each in more detail.
1. Take a Balanced Approach to Management Pressure
Too much pressure leads to:
- Deals only being entered into Salesforce when reps are highly confident
- Weak deals remaining in the pipeline indefinitely
The result is poor visibility and unreliable forecasting.
2. Establish a Pipeline Review Cadence
High-performing teams hold weekly or bi-weekly pipeline reviews that are never skipped. Forecasts become a natural output of these sessions—not a last-minute scramble.
Review opportunities using the Close Date and Stage Report to identify:
- Deals overdue in past months
- Opportunities with unrealistic stages or timelines
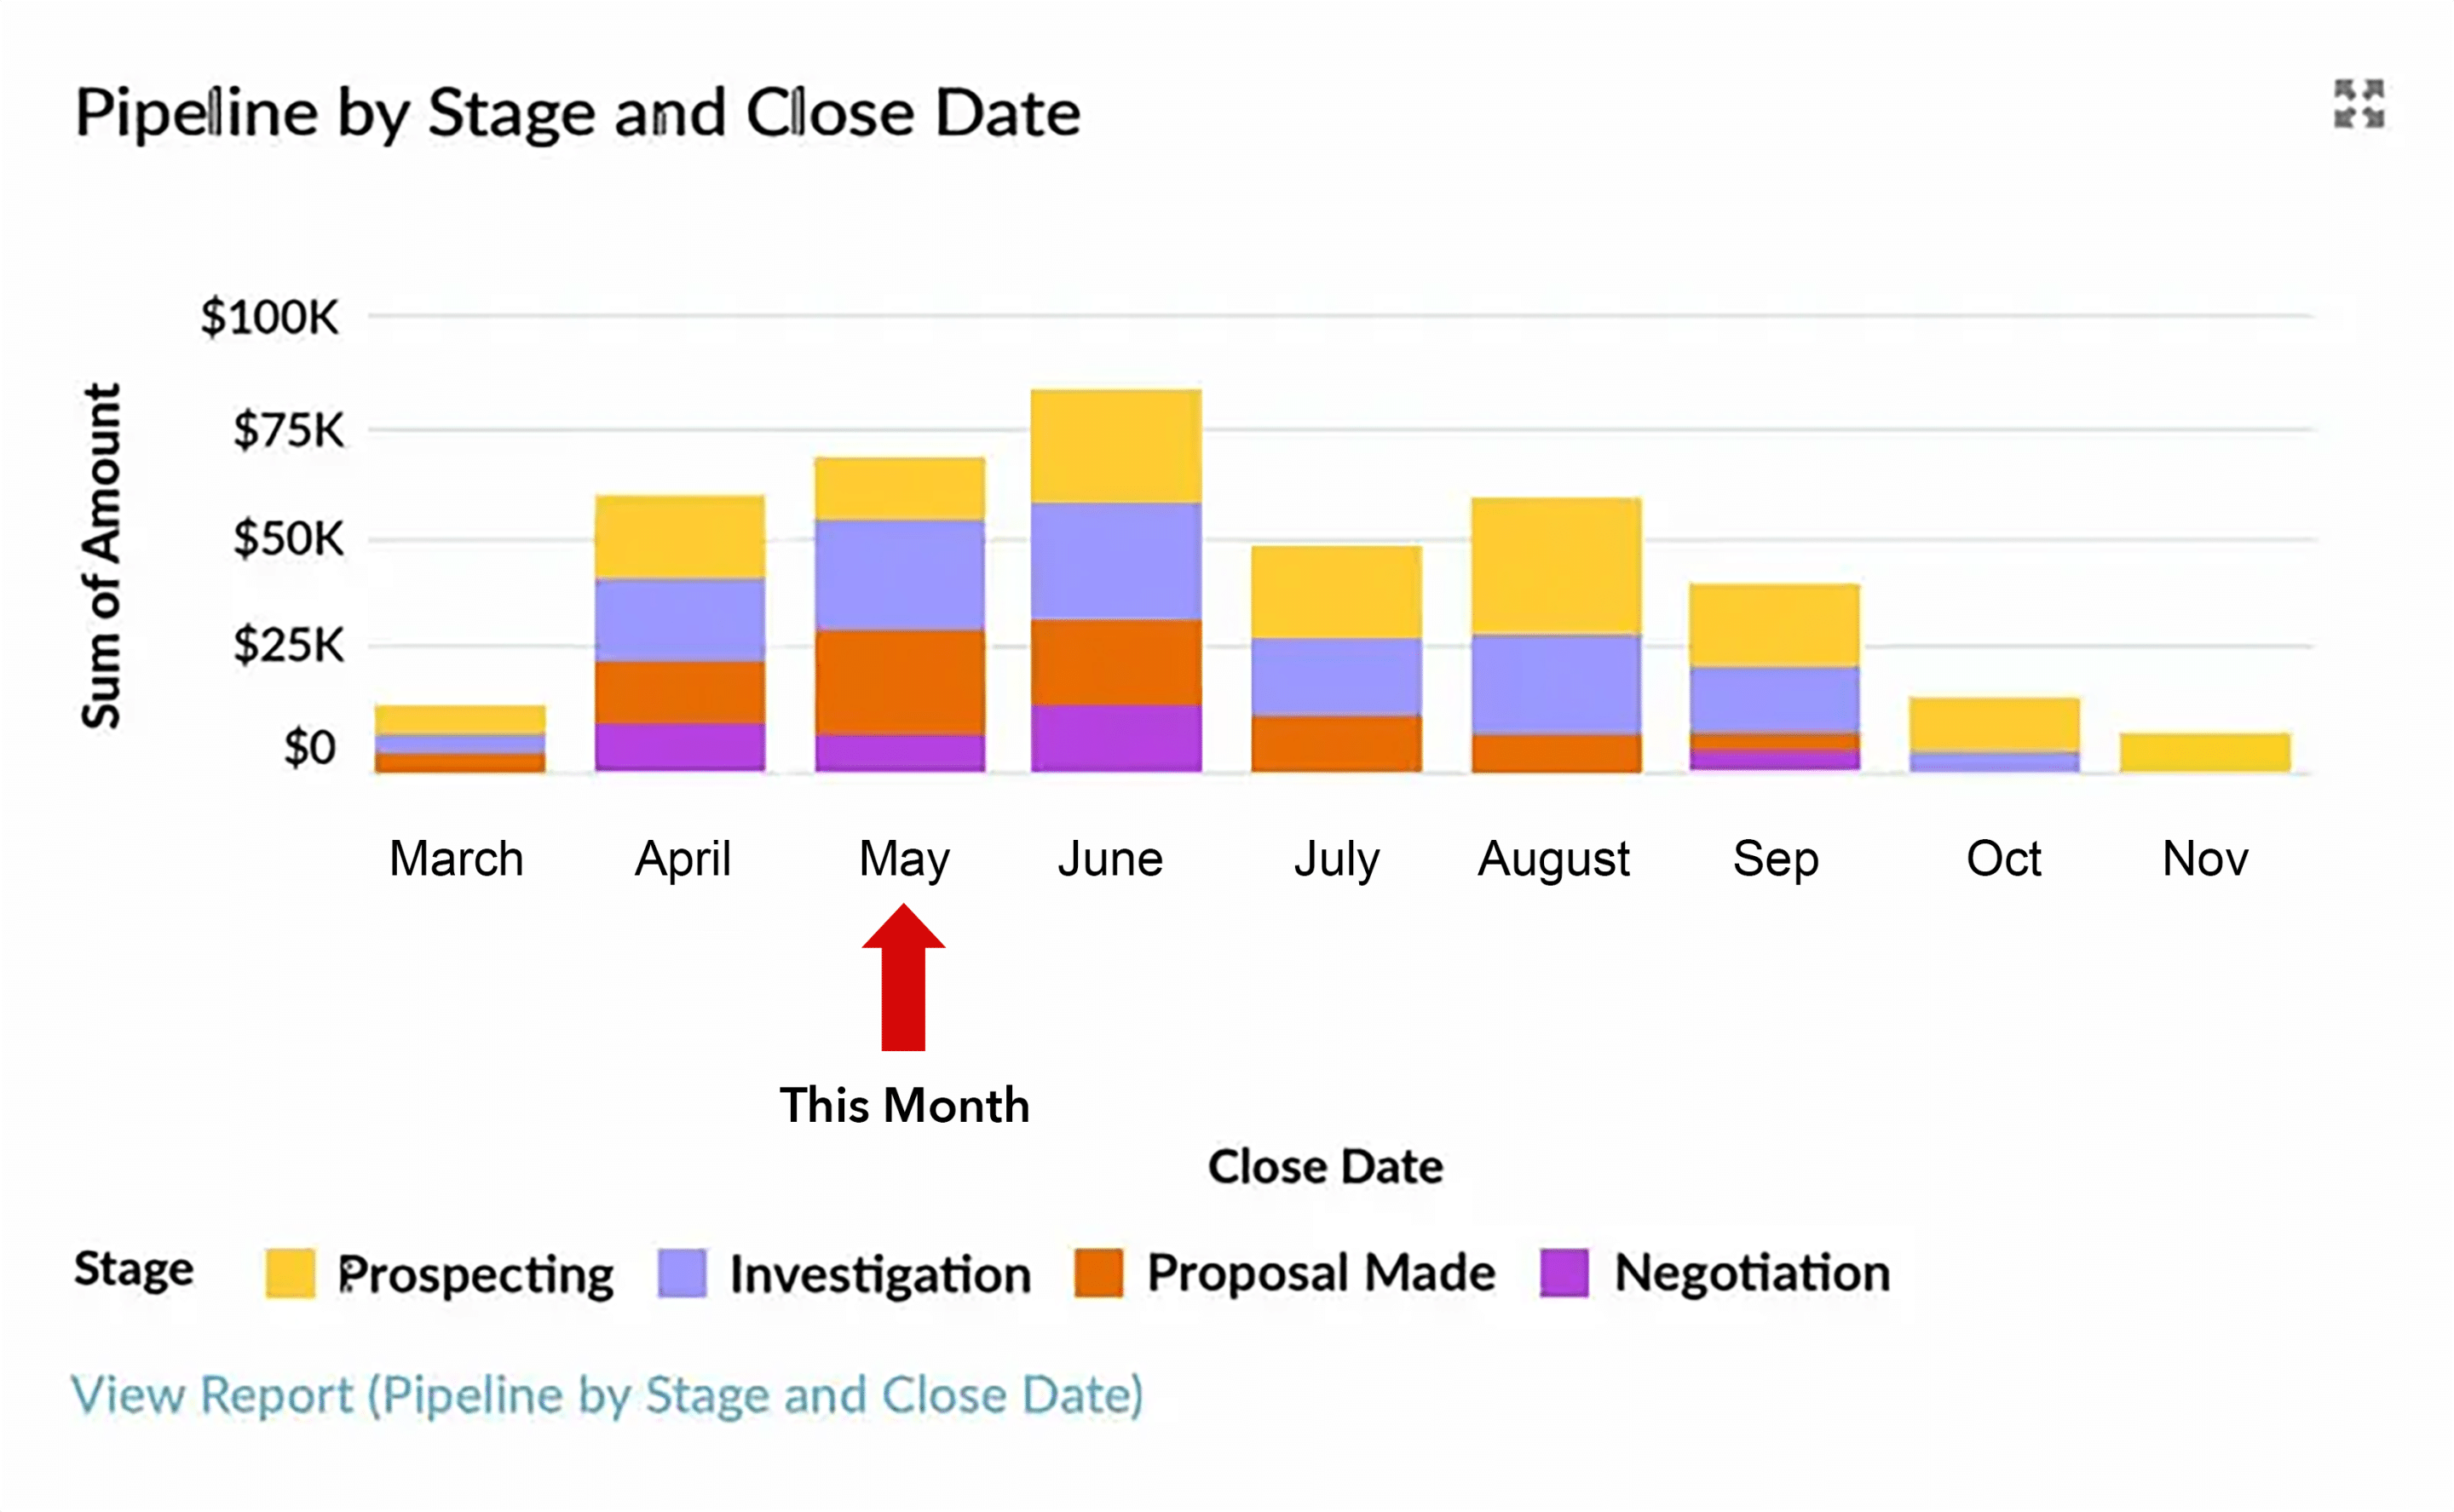
This chart and underlying sales forecast report groups pipeline opportunities by Close Date (x-axis) and stacks them by Stage. The Opportunity Stages with Close Date report gives you essential information for assessing pipeline health and correcting glaring errors in your sales forecast.
For example, here are some questions we can ask about the chart and report.
Close dates in the past
The chart shows some pipeline opportunities due to close in the past, which is a common problem.
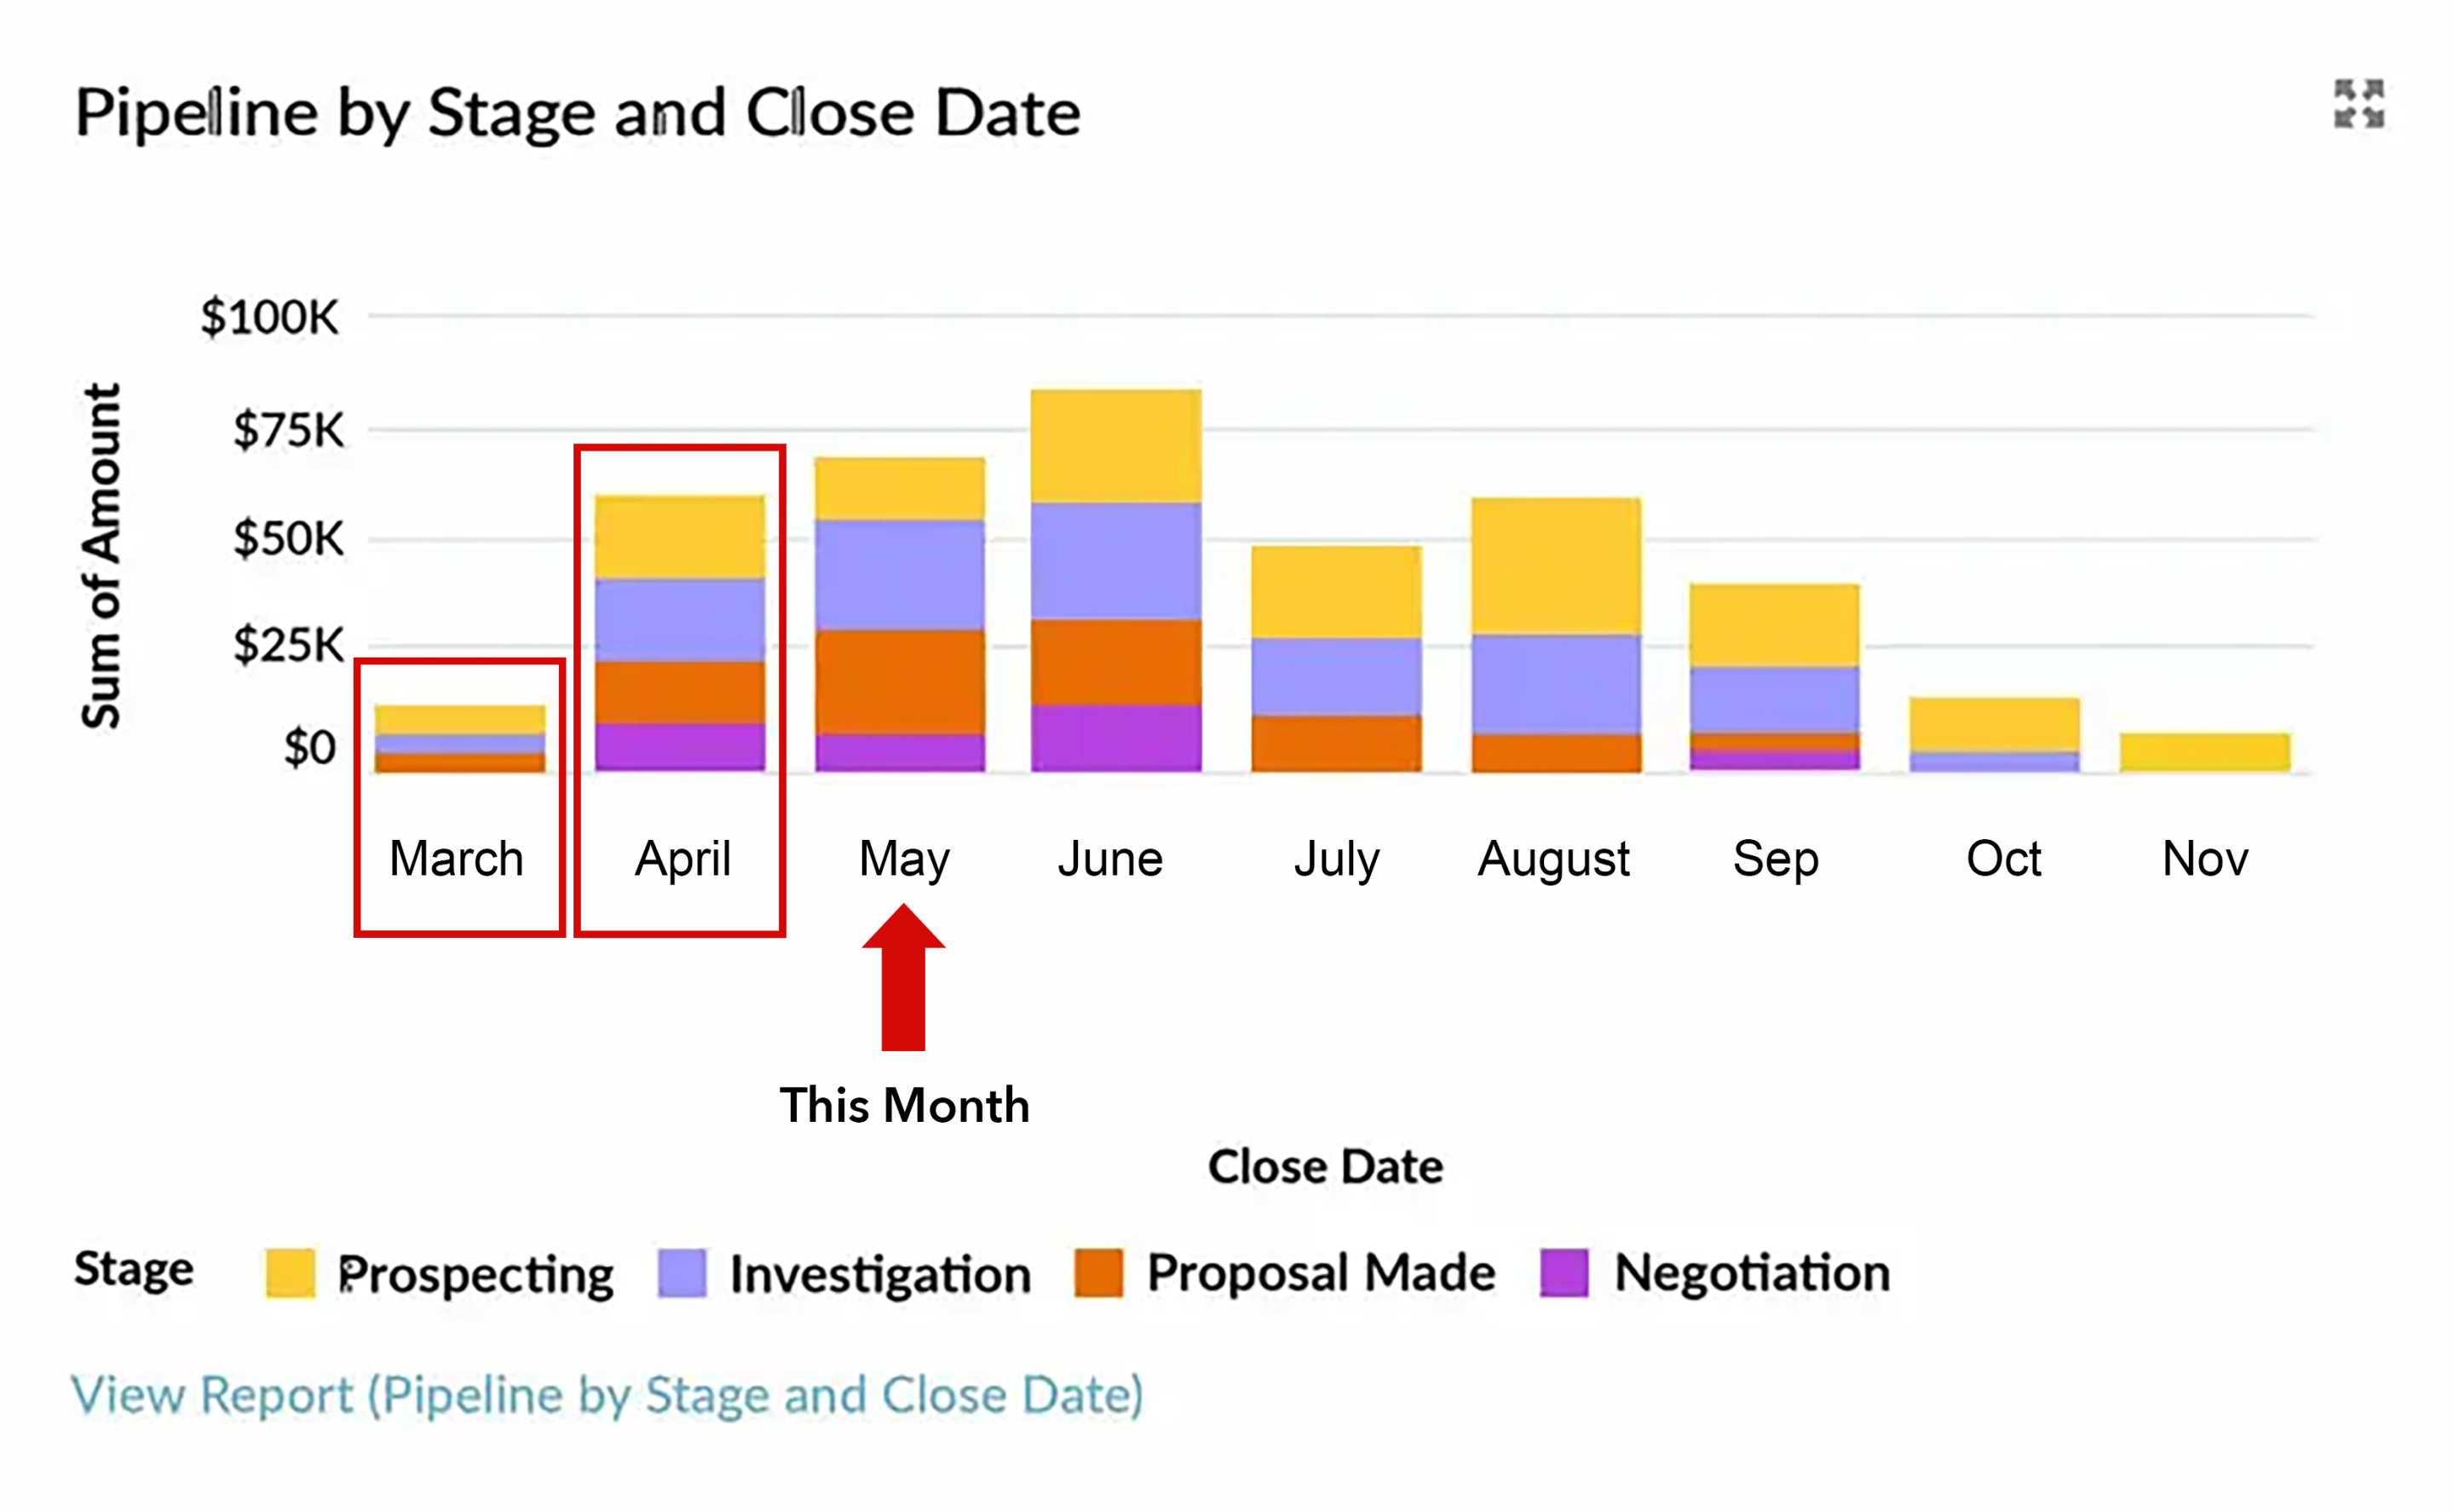
We need to ask why those deals are in previous months:
- Are they still open?
- If so, will they close in the current month?
- Or are they no longer viable deals that the salesperson should remove from the pipeline?
Addressing this is the first step to getting a reliable sales forecast for the current month or quarter.
Opportunities with unrealistic stages or close dates
Imagine your sales process is typically 3 months. Naturally, some deals on your pipeline chart take longer, and others proceed more quickly.
Ask yourself:
- Are you confident about those deals due to close in the current month?
- Which deals are currently in the early stages and may not progress through to completion?
- Is there a robust close plan for deals at advanced stages?

3. Align Stages and Probabilities with Your Sales Process
When stages overlap or lack clarity, salespeople interpret them differently—and forecasts suffer. Clear definitions and alignment are essential.
Qualify Deals Throughout the Sales Cycle Using Clear Exit Criteria
Top performers don’t qualify once—they re-qualify continuously.
Most salespeople think about qualification as a one-time activity on each opportunity – using BANT, MEDDIC, or another well-known methodology to validate the opportunity. However, top-performing salespeople re-qualify each deal regularly throughout the sales cycle. And the best way to help your sales team do this is to build a sales process in Salesforce, which uses Lightning Path to summarize the exit criteria and determine when an opportunity is ready to move from one stage to the next.

That way, you increase your team's consistency in calibrating opportunities in your sales forecast. It also helps ensure salespeople are not wasting time on opportunities they may be reluctant to let go of psychologically.
5. Use Pipeline Quality Metrics to Identify Troublesome Opportunities
Three metrics consistently identify risky deals:
- Number of Close Date month extensions
- Days since last stage change
- Total days open
Deals that score poorly on these metrics should be scrutinized before being included in the forecast. For example, many managers will carefully consider before including this deal in their month-end sales forecast:

And collating these metrics in a dashboard table provides an easy-on-the-eye way to immediately spot deals at risk of slipping from your forecast:

6. Sense Check Using Win Rate Reports
If experience suggests a 30% win rate, but Salesforce indicates a 70% win rate, something is amiss.
Either:
- Only late-stage deals are being entered
- Dormant deals aren’t being removed
Either way, your forecast is distorted.
Start by checking whether the historic opportunity conversion rates are realistic. For example, in your business, instinct and experience tell you the win rate of opportunities should be around 30%. So, how do you explain a conversion rate report in Salesforce that shows the win rate is 60% or more?

Well, there are two explanations.
- Salespeople only enter deals into the pipeline once they are confident a deal will close successfully.
- Dormant deals need to be removed from the pipeline.
Of course, both these things may be accurate at the same time. Either way, if this is happening, your Expected Revenue report and sales forecasts are skewed.
7. Agree on Close Plans—Avoid “Commit” Forecasting
Asking reps to “commit” to deals is like asking a soccer striker to guarantee a goal. Effort helps—but outcomes aren’t fully controllable.
Instead, insist on customer-approved Close Plans outlining the steps required to complete the deal. If the customer won’t agree to the Close Plan, be cautious about including the deal in your forecast.
Where Can You Get a Sales Forecasting Template?
Download the free GSP Sales Dashboard from the AppExchange to improve forecast accuracy.
Installed over 7,500 times, it includes:
- All reports referenced in this guide
- A comprehensive, drill-down dashboard
- Built-in deal quality metrics
You’ll also get a configuration guide and a dedicated article covering 12 must-have Salesforce dashboard charts.
Sales Forecasts: FAQs
Waterlogging happens when the pipeline or sales forecast contains multiple deals that have little change of closing successfully. The main cause is reps failing to remove dormant deals from the pipeline. The waterlogging analogy comes from the idea of sales managers wading around knee-deep in water looking for a patch of dry land.
Got a Salesforce Challenge? Let's Tackle It Together.
Book a free 45-minute consultation with one of our Salesforce experts. You set the agenda — we'll give you honest, practical advice you can act on straight away.
Free Salesforce Review · 45-Minute Video Call · You Choose the Topic