4 Ways To Measure Sales Targets In Salesforce
How to Avoid the Frustration of Measuring Sales Targets in Salesforce by Learning How to Track Sales vs Quota.
Last updated March 13, 2026


Download the 12 Must-Have Charts for Your Salesforce Dashboard eBook today!
When it comes to managing your sales targets in Salesforce, you need to answer three essential questions:
- How does historical sales performance compare to the quota?
- Is the pipeline coverage sufficient to meet the target this month, next month, or next quarter?
- What is the best way to measure sales against rep, team, product, territory, and company targets?
Once you can measure your sales targets in Salesforce, it becomes much easier to join the league of high-performing sales teams, who enjoy quota attainment rates of 70% - 85%. With visibility of target performance and pipeline coverage, you can see how to continually adjust and optimize your sales performance metrics.
However, as many executives are aware, tracking sales targets in Salesforce can be frustrating because there is no 'Targets' tab to display your team's performance against quota.
So how do you access the sales target reports you need?
In this blog, I describe four options for gaining visibility into your sales targets in Salesforce: GSP Target Tracker, dashboard gauge, Salesforce forecasting, and the Lightning home page's quarterly performance chart. I also explain when each option is best to help you determine which is right for your business.
4 Ways To Measure Sales vs Target in Salesforce
How Do I Measure Sales Against Target?
The following video explores one of the simplest ways to measure your sales targets in Salesforce. If after watching you have any questions about how it would work in practice for your organization, please contact us – we’d love to hear from you.
Why Are Sales Target Reports in Salesforce Critical?
A sales target report displays your revenue or quantity goal(s) for a specific period. Depending on how your business operates, you set quotas for salespeople, teams, products, and/or the entire business. Sales target reports are essential because they allow you to track past performance against targets and compare won and pipeline deals with current and future goals.
I mainly use the word 'target' in this article. In your business, you might prefer 'quota' or 'budget.' You may even talk about 'hitting the number'. I assume they are all the same thing here.
With that, let's talk about time periods.
What Are The 3 Periods a Sales Target Report Should Show?
In most businesses, the sales target report measures revenue or quantity sold against quota for three different periods: historical, current, and future targets. In the following sections, we delve into these topics in more detail.
1. Historical Sales Target Reports
Historical sales targets are in the past – for example, those for the last month, quarter, or year. The one critical piece of information you need the report to tell you is: was the sales revenue higher or lower than the quota?

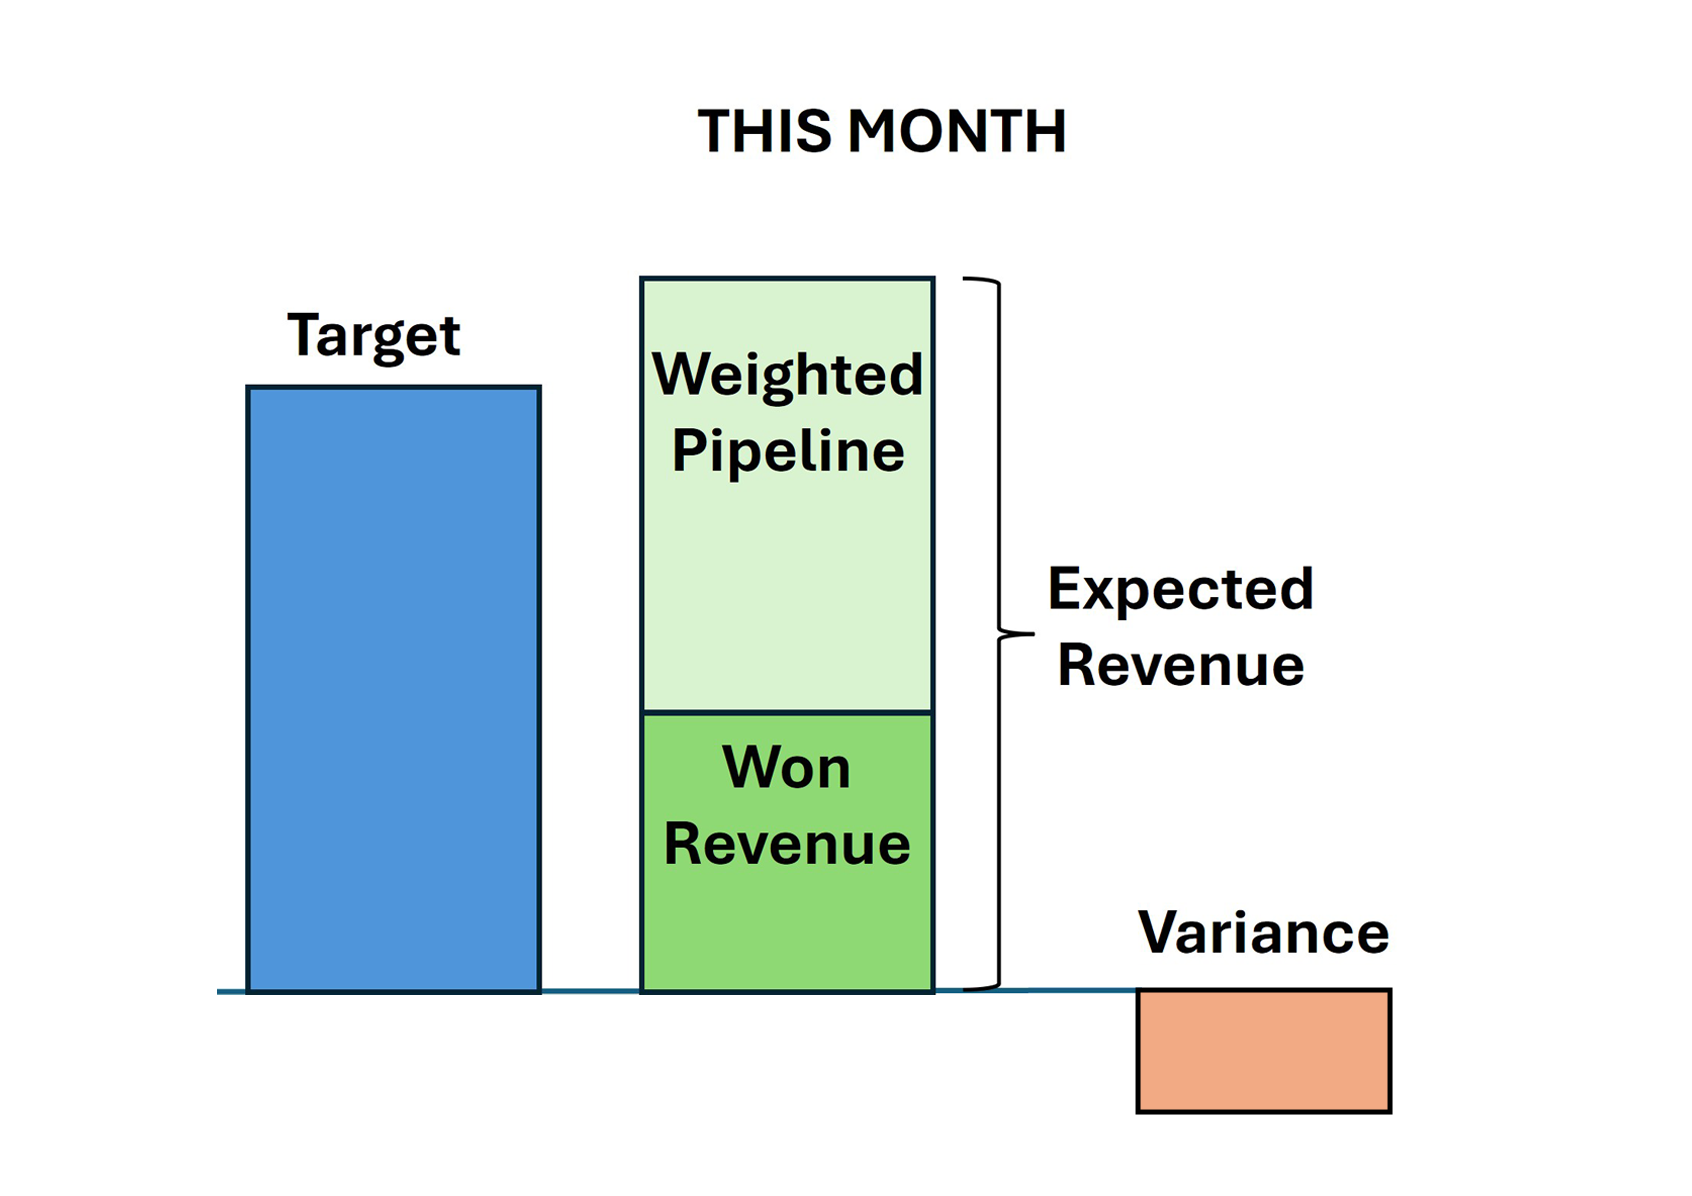
2. Current Sales Target Reports
Current sales targets are those we are working to achieve right now – for example, this month, quarter, and year. However, we must compare the target with the sum of two metrics:
- Sales revenue already won.
- Size of the pipeline that is due to close in the period.
More specifically, we likely want to add the won revenue and the weighted pipeline to compare the expected revenue with the quota.
3. Future Sales Target Reports
Future sales targets are upcoming – for example, targets that are due to close next month, quarter, and year. With these targets, we have zero won revenue because a deal can't close successfully in the future.
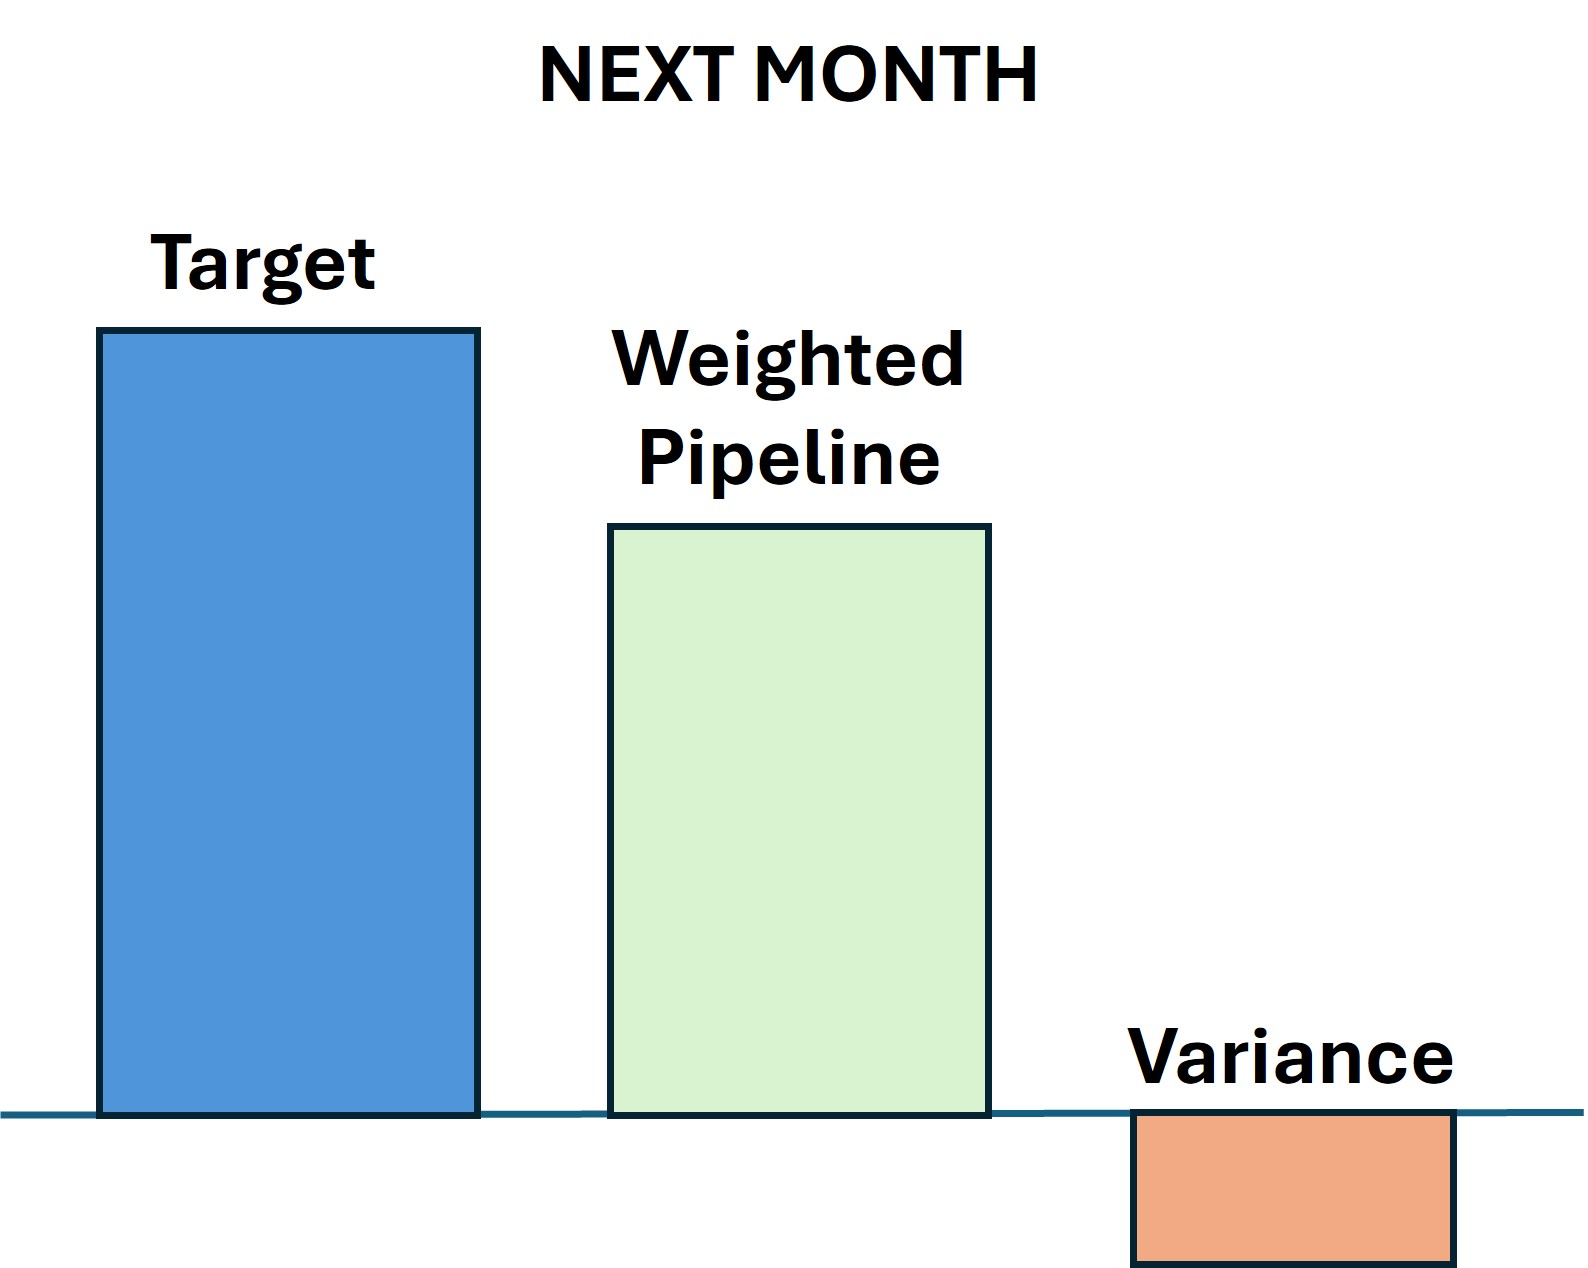
Your future sales target report is critical because it helps you to answer the big question: “How do I know if my pipeline coverage is enough to hit the target?”
Pipeline coverage is king because it allows you to compare future targets with the weighted pipeline. Sometimes, people try to take a shortcut by setting a goal of 3x pipeline coverage – they believe if the funnel is 3x bigger than the target, they’re likely to hit quota – but it’s a high-risk strategy with better alternatives available.
"So, How Do I Measure Sales Against Target in Salesforce?
It's a great question, and one I hear often. The answer is, there are four primary options available to help you measure your sales targets in Salesforce:
- GSP Target Tracker
- Dashboard gauge
- Forecasts tab
- The Lightning home page performance chart
Each option provides you, your salespeople, and your teams with different levels of information and target tracking experience. In the following sections, we'll explore each in more detail.
Option 1: Use GSP Target Tracker to Measure Sales Targets in Salesforce
GSP Target Tracker allows you to set sales targets in Salesforce for salespeople, teams, products, and the company. Unlike the other available options:
- You can create different types of targets – for example, new logos versus existing logos.
- Opportunities automatically link to the relevant targets, so your salespeople don't have to perform additional work.
- The visual target display, reports, and dashboard charts make it easy to determine if pipeline coverage is sufficient to meet the your target.
In the example below, we see the team targets for the current month:
The chart on the left shows the team's overall performance, including pipeline coverage vs quota.
The chart on the right analyzes the pipeline for the month. In this case, we can see Dave Apthorp owns nearly half the total pipeline. We can also see individual team member performance for the month in the chart below.
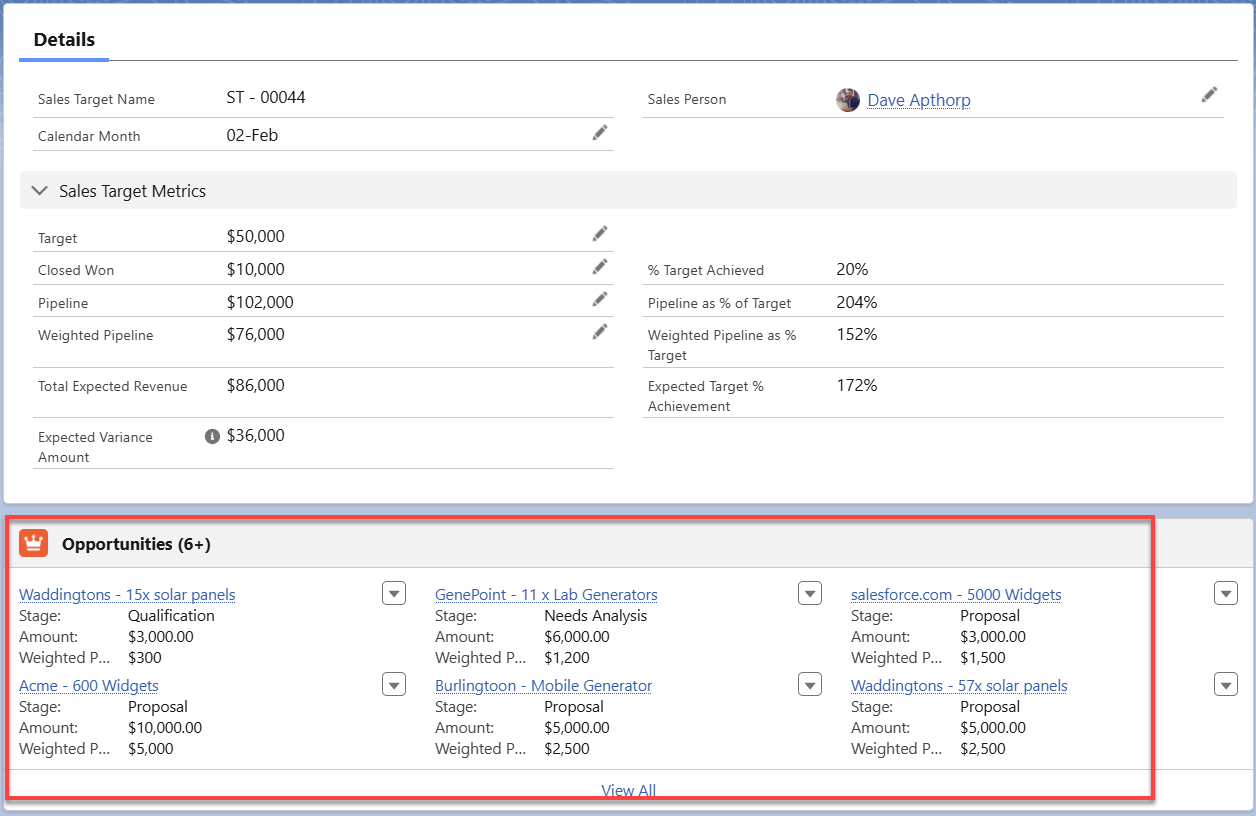
The image below shows the opportunities automatically linking to the target records. GSP Target Tracker does this based on the 'Close Date' of the opportunity and the 'Opportunity Owner'.
Dashboard charts within the GSP Target Tracker summarize company, team, and salesperson information. For example, the Sales Manager Dashboard provides the target tracking and pipeline visibility you need to manage teams effectively.

Additional dashboards deliver information on team and product performance, conversion rates, won deals, and pipeline quality metrics.
Benefits and Limitations of Using GSP Target Tracker for Your Sales Target Reports
Pros:
- Easy for sales reps and managers to use because opportunities automatically link to relevant quotas.
- Highly visual information on sales performance and pipeline coverage against the target.
- Powerful reports and dashboard charts provide information on performance at the company, team, and individual levels.
- Easy to install and set up.
- Wizard-based interface for creating different target 'types'.
- Company-specific customizations are also available.
Cons:
- Requires a per-company license fee – but this means unlimited users, making it more cost-effective than per-seat tools.
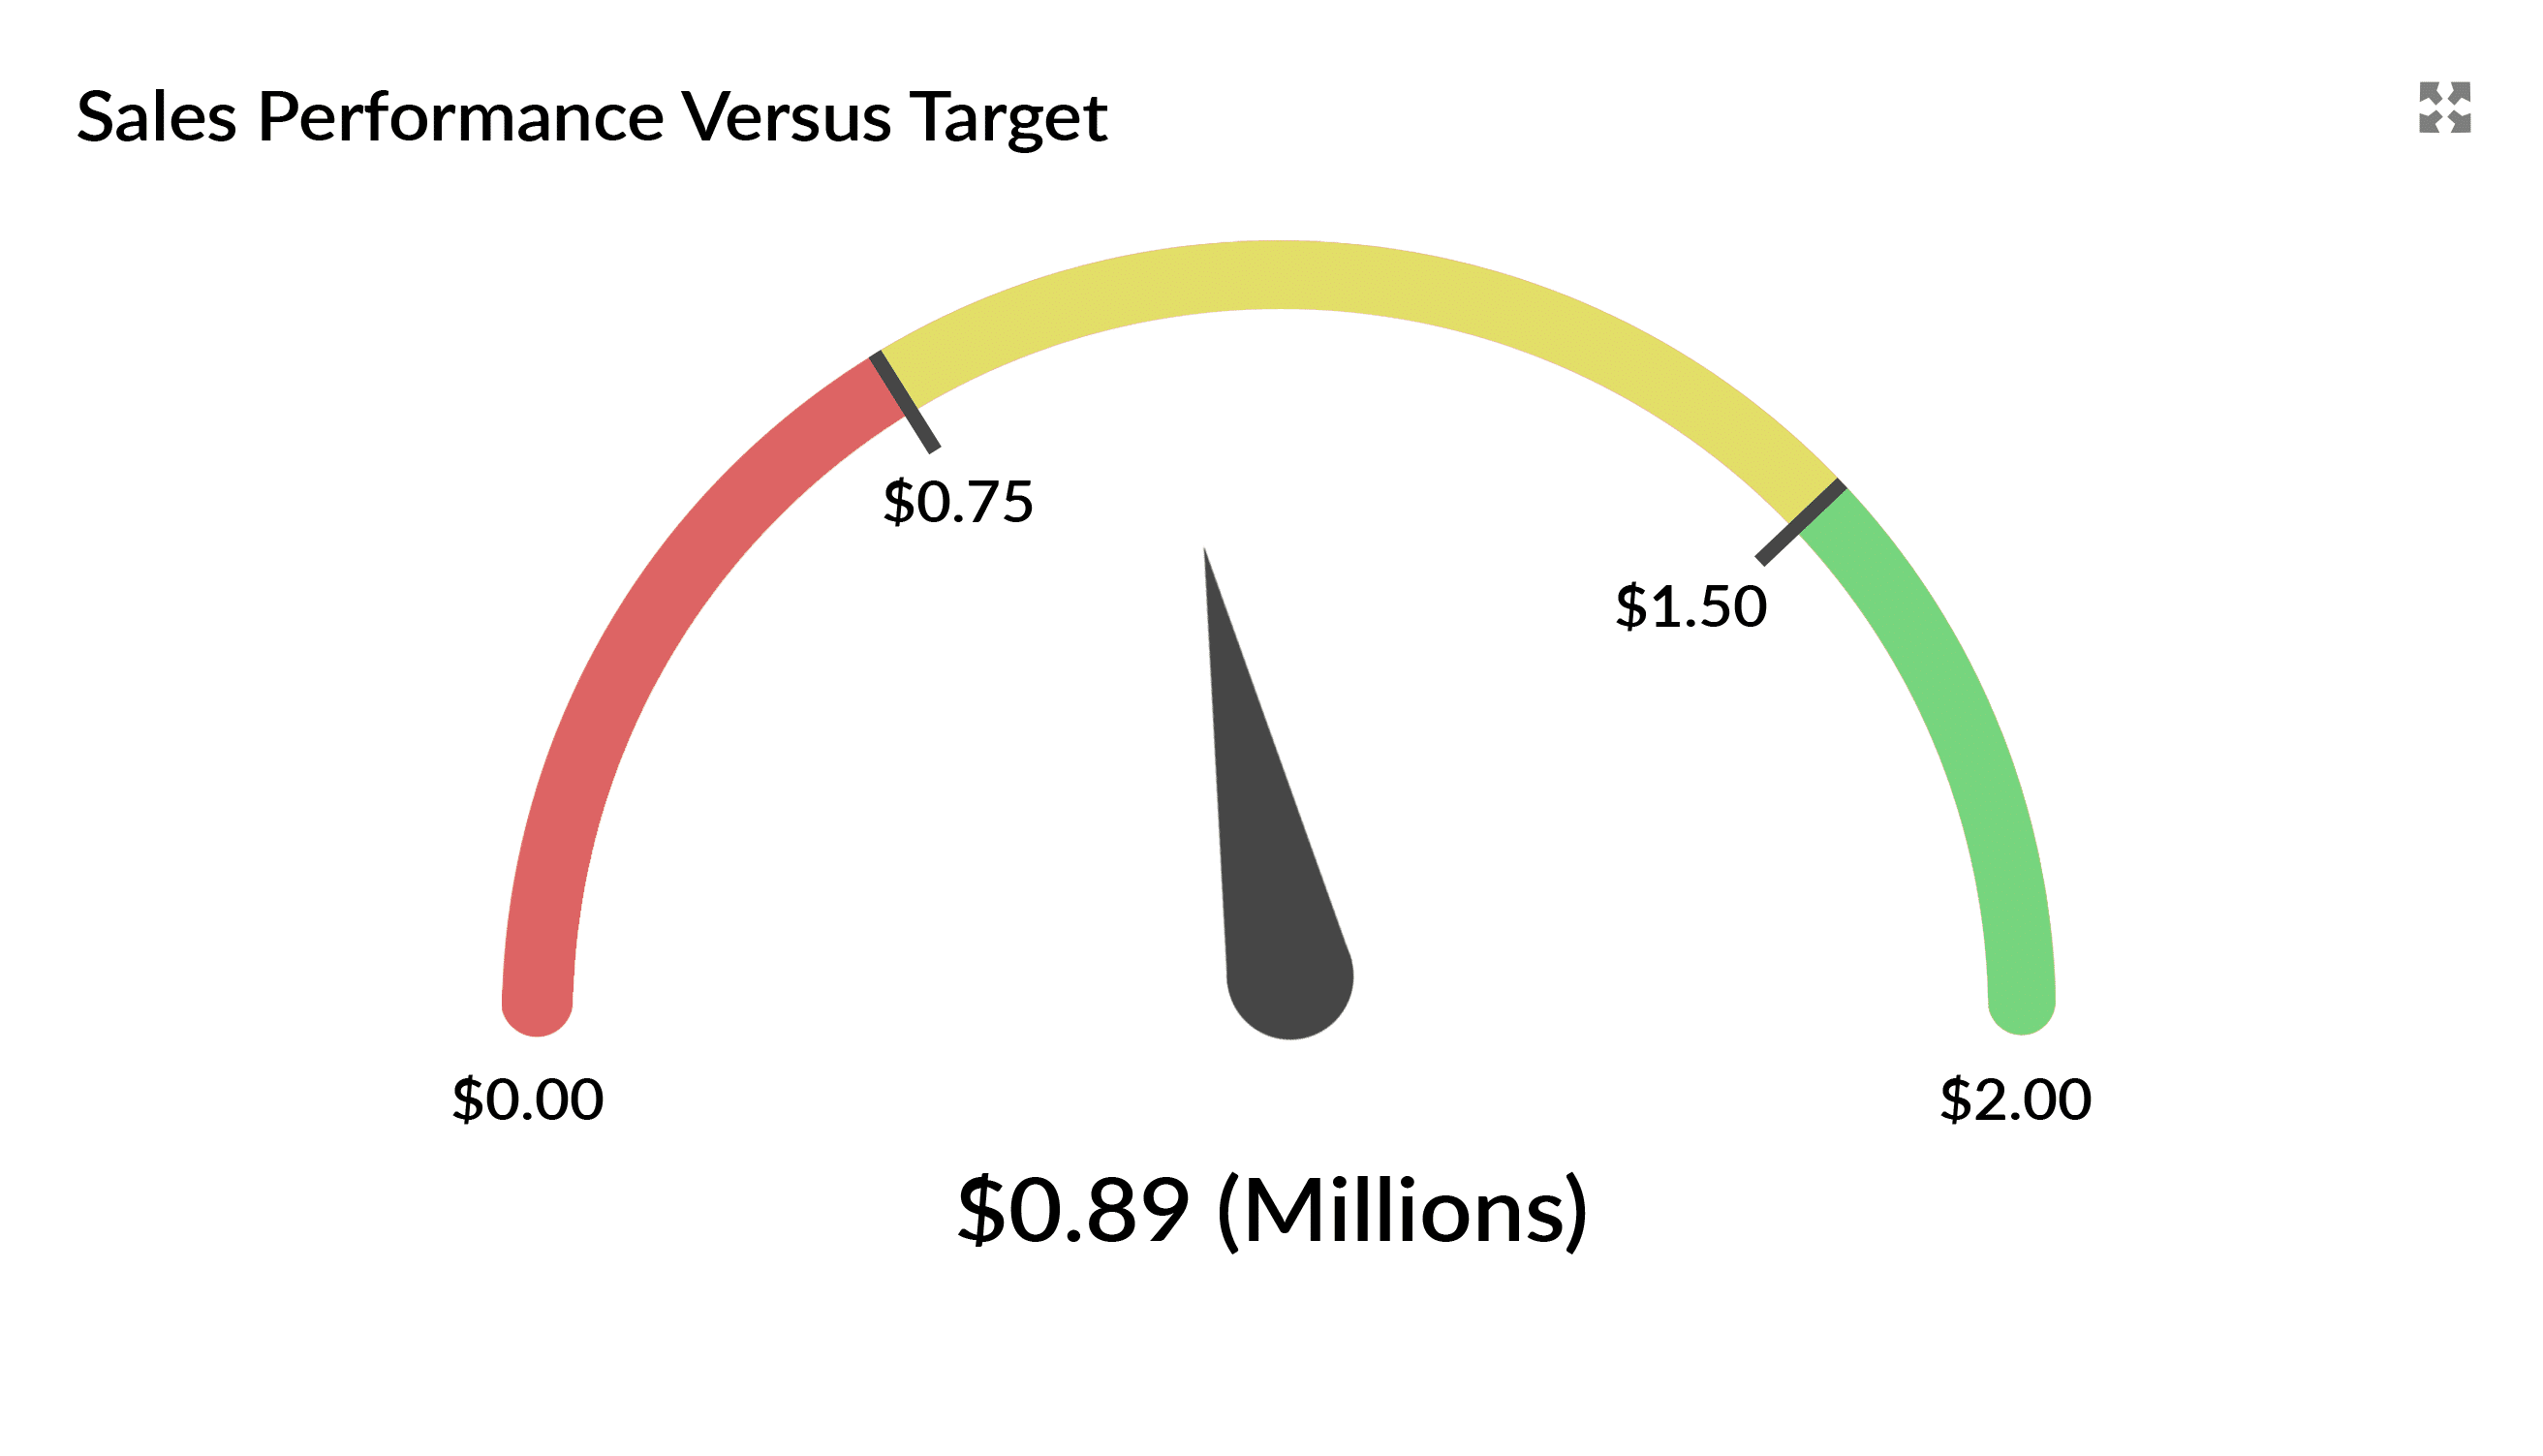
Option 2: Use Dashboard Gauge to Measure Sales Targets in Salesforce
The Salesforce dashboard gauge displays your overall sales against quotas. The arrow indicator shows sales won, and the gauge's red, amber, and green segments define relevant breakpoints – for example, we use amber to represent 80% of sales target achievement and green for 100%.
The gauge relies on an underlying sales report that summarizes the value of deals won over the relevant period. It's handy when you use the gauge alongside other dashboard charts to get full sales performance and pipeline visibility for your sales target report.
Benefits and Limitations of Using Dashboard Gauge for Your Sales Target Reports
Pros:
- Simple to set up.
- Easy way to understand quota performance visually.
- Quick and straightforward high-level summary of sales performance against target.
Cons:
- Simplistic target metric – for example, when measuring performance at the company level, individual rep or sales team revenues are not visible vs the target.
- Breakpoint values must be manually reset for each target period; for example, if month-on-month targets differ, the system administrator must adjust the breakpoints accordingly each time.
- There's no visibility of pipeline deals. Unfortunately, this means we don't know if there's enough pipeline coverage to meet the sales target for next month. There's nothing to tell us, for example, if winning 30% of pipeline deals means we'll exceed the budget.
Option 3: Use Salesforce Forecasting to Measure Sales Targets in Salesforce
The ‘Forecasts’ tab is the standard function in Salesforce for target measurement and providing information on won and pipeline deals vs quota.

It's an advanced method of comparing sales vs quota where:
- You can view closed won opportunities that contribute to sales targets in the forecasts tab.
- Pipeline deals also appear, providing valuable insights into the strength of the funnel and the likelihood of achieving sales goals.
- You can override the forecasts made by your direct reports – for example, you can change the overall estimate to balance salespeople's excessive optimism or pessimism.
However, there is a downside: the functionality is challenging to use (and that's being generous!).
As a result, significant training and coaching are necessary to use the forecasts tab effectively and track performance against your sales targets in Salesforce.
Benefits and Limitations of Using Salesforce Forecasting for Your Sales Target Reports
Pros:
- You can set sales targets at individual, team, company, and product family levels.
- Tracks performance against quota based on the opportunity forecast category (won, committed, pipeline, and best-case).
- Managers can override forecasts submitted by their direct reports, modifying the expected performance against current and future team targets.
- Retained history to learn from the accuracy of forecasts submitted in the past.
Cons:
- Successful roll-out and ongoing adoption require significant preparation and implementation effort.
- The forecasts tab is hard to maintain and use compared to other areas of Salesforce functionality.
- Sales reps and managers need careful training to use Salesforce forecasting effectively.
- Salespeople manually update their forecasts to make the overall sales projection more reliable. That means a high level of commitment across the team is essential to fully benefit from the forecasts tab.
Option 4: Use the Lightning Home Page Quarterly Performance Chart
The 'sales performance chart' is available by default on the Salesforce Lightning home page. As shown in the example below:
- The green line is the sales goal.
- The orange line shows the value of closed-won opportunities.
- The blue line indicates closed-won and opportunities with a probability of over 70%.

Benefits and Limitations of Using Lightning Quarterly Performance Chart for Your Sales Target Reports
Pros:
- It's free to use as a standard Salesforce Lightning feature.
Cons:
- Only the quarterly sales goal appears – there's no monthly breakdown.
- No drill-down to see the underlying opportunities.
- Sales managers cannot see the Lightning Quarterly Performance Chart of their team members.
- There's no way to adjust the 70% setting – for example, it's not possible to include opportunities of over 50%.
What is the Best Way to Track Sales Targets in Salesforce?
Bottom line: if you want to track your sales targets in Salesforce easily and efficiently, the GSP Target Tracker is the best option. The following table shows you why, by comparing the ideal scenarios for when it’s best to use each of the four options:
GSP Target Tracker:
- A straightforward way to get clear insights into quota attainment and pipeline coverage.
Dashboard Gauge:
- A simple measurement of sales targets, which is good if you urgently need a sales target report.
- You only need to measure top-level performance against sales targets.
- Sales targets are the same for each period.
Forecasts Tab:
- Good when you have complex target measurement requirements.
- Sales managers often override the forecasts submitted by their salespeople.
- Appropriate training is available for salespeople and managers.
Lightning Quarterly Performance Chart:
- Good if your targets are straightforward and align with how the Quarterly Performance Chart works.
Try GSP Target Tracker for Yourself
If you’re looking for a better way to measure your sales targets in Salesforce, why not install GSP Target Tracker from the AppExchange and try it for yourself?
In just a few simple clicks, you’ll be able to:
- Compare won and pipeline revenue against individual and team targets.
- Easily see whether there is enough pipeline to hit your sales quota.
- Track target and pipeline coverage at individual, team, and company levels.
Want to learn more? Use this blog post for detailed guidance on measuring sales and pipeline coverage versus your target in Salesforce.
Ways To Track Targets: Commonly Asked Questions
Yes – but only if it's necessary to drive a strategic shift in business direction.
For example, if a large majority of revenue comes from existing customers, and the strategy is to drive growth by increasing sales to new customers, separate targets for a new logo and the existing logo revenue make sense. Conversely, in some businesses, most sales are made to new customers. If the company aims to farm the existing customer base more effectively, it's logical to have two different targets for the same period.
But remember, simpler is better.
Sales targets are most effective as a motivational tool and are easier to manage when they are straightforward and not overly complex. As such, we recommend not creating different types of targets unless there’s a strong business imperative.